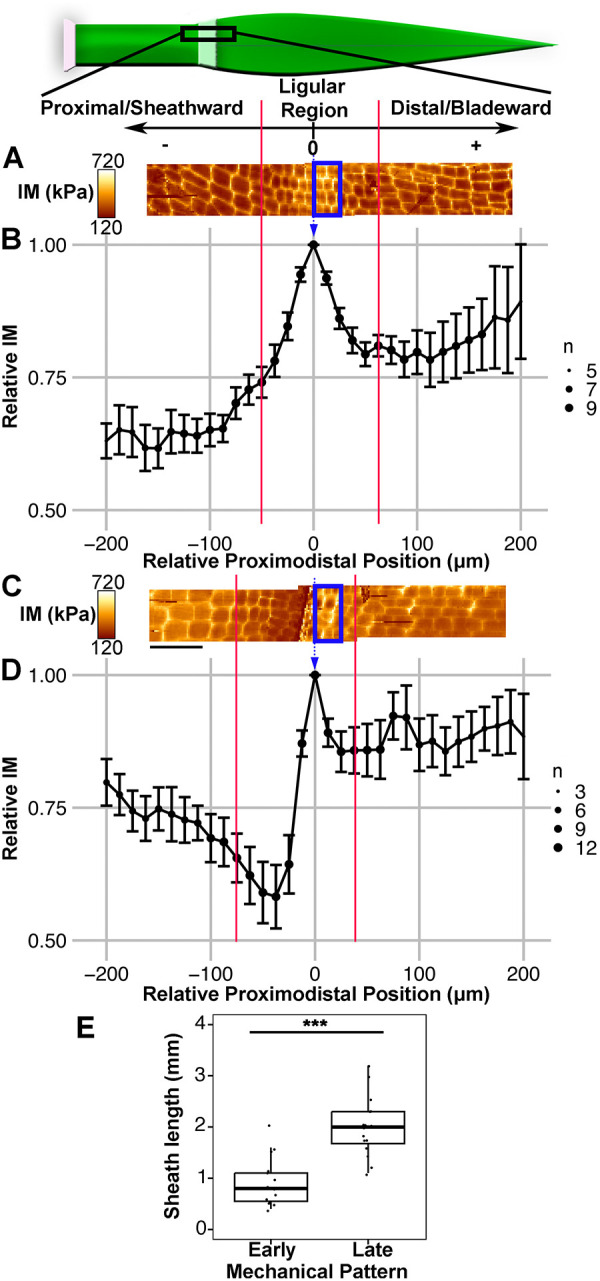
Fig. 5.

AFM analysis of ligular region reveals two distinct mechanical phases during ligule development. Scale and cartoon at top show orientation of leaf and region of interest for AFM scans and sliding window analysis, with the local maximum in IM for each leaf set as position 0. (A) Representative scans of leaf in the PLB stage reveals a local maximum in IM within the PLB. Two overlapping 50×200 μm scans are shown. Blue box indicates the position of the window for the measurement at relative position 0. Red lines indicate limits of the ligular region. (B) Sliding window analysis averaging all B73 samples exhibiting the early pattern (early PLB and PLB stages; n=9). (C) Representative scans of leaf in the early fringe stage. (D) Sliding window analysis averaging all B73 samples exhibiting the late pattern (late PLB and early fringe stages, n=13). A and C are to scale relative to B and D. Scale bars: 50 μm. Size of dot (n) indicates coverage at that relative position. Error bars indicate standard error. (E) Sheath lengths of leaves with the early and late mechanical patterns. ***P<0.01 (Mann–Whitney U-test). Box plot shows the first to third quartiles as boxes, with the center line indicating the median. The rest of the range, excluding outliers, is indicated by the whisker lines. All data points, including outliers, are shown as dots.
