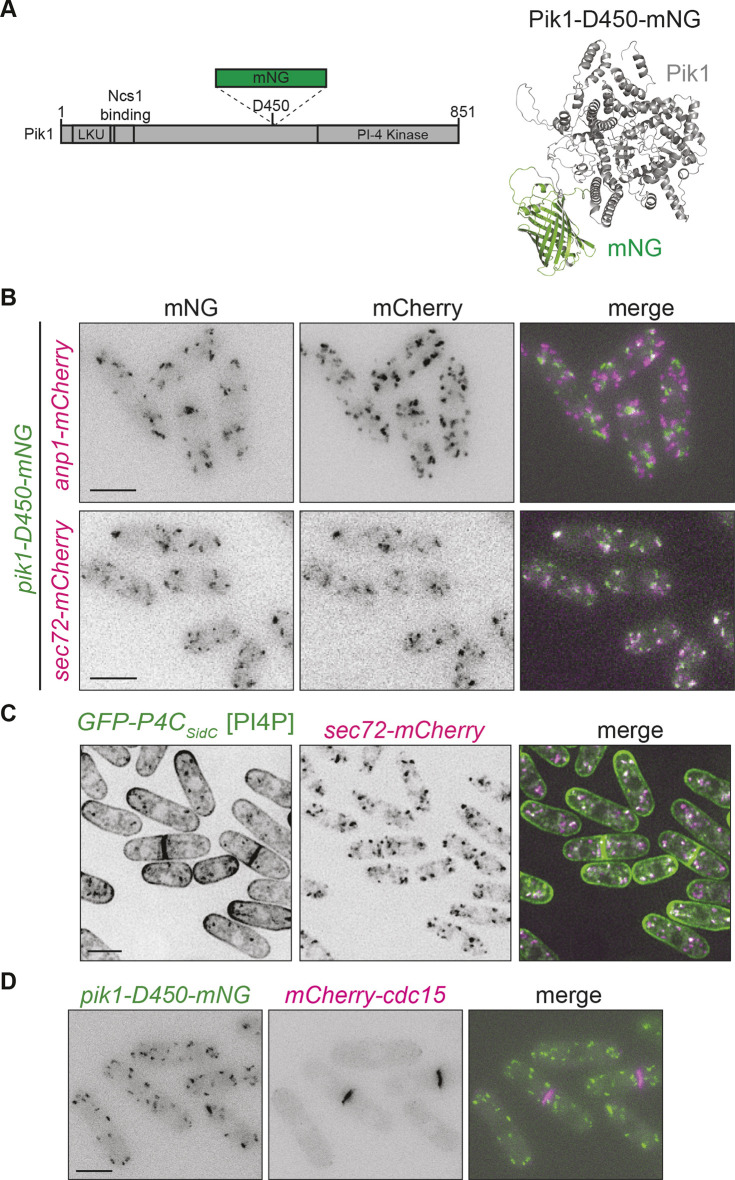
Fig. 3.
Pik1 localizes exclusively to the trans-Golgi. (A) Left, a schematic of Pik1 drawn to scale with domains, mNG and the insertion site labelled. Right, AlphaFold2 predicted structure of Pik1 with mNG inserted after residue D450. Pik1 is gray and mNG is green. (B) Live-cell images of cells expressing Pik1-D450–mNG with Anp1–mCherry or Sec72–mCherry. (C) Live-cell imaging of cells expressing GFP–P4CSidC with Sec72–mCherry. (D) Live-cell imaging of cells expressing Pik1-D450–mNG with mCherry–Cdc15. Images are representative of two repeats. Scale bars: 5 μm.

