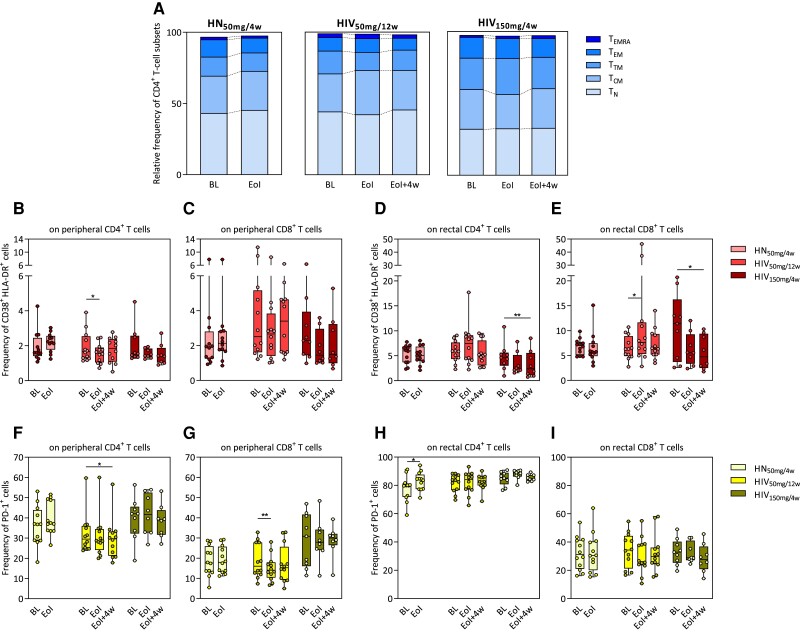
Figure 3.
Effect of obefazimod on T-cell activation. A, Upper graph shows the relative frequency of different CD4+ T-cell subsets in the study groups identified in peripheral blood mononuclear cells by flow cytometry. Bars represent medians of each subset. B–I, Immune activation levels determined as percentages of CD38+HLA-DR+ (B–E) and PD-1+ (F–I) cells analyzed both in peripheral and rectal CD4+ and CD8+ T-cell populations by flow cytometry. B and C, Frequency of CD38+HLA-DR+ cells from peripheral CD4+ and CD8+ T cells. D and E, Frequency of CD38+HLA-DR+ cells from rectal CD4+ and CD8+ T cells. F and G, Frequency of PD-1+ cells from peripheral CD4+ and CD8+ T cells. H and I, Frequency of PD-1+ cells from rectal CD4+ and CD8+ T cells. Median and interquartile range are represented. Asterisks denote significant differences between timepoints detected using the Wilcoxon signed-rank test (*P ≤ .05; **P ≤ .01). Abbreviations: BL, baseline; EoI, end of intervention; EoI + 4w, 4 weeks after end of intervention; HIV50mg/12w, HIV infected taking once-daily oral obefazimod 50 mg for 12 weeks; HIV150mg/4w, HIV infected taking once-daily oral obefazimod 150 mg for 4 weeks; HN50mg/4w, HIV negative taking once-daily oral obefazimod 50 mg for 4 weeks; TCM, central memory T cells; TEM, effector memory T cells; TEMRA, effector memory RA T cells; TN, naive T cells; TTM, transitional memory T cells.

