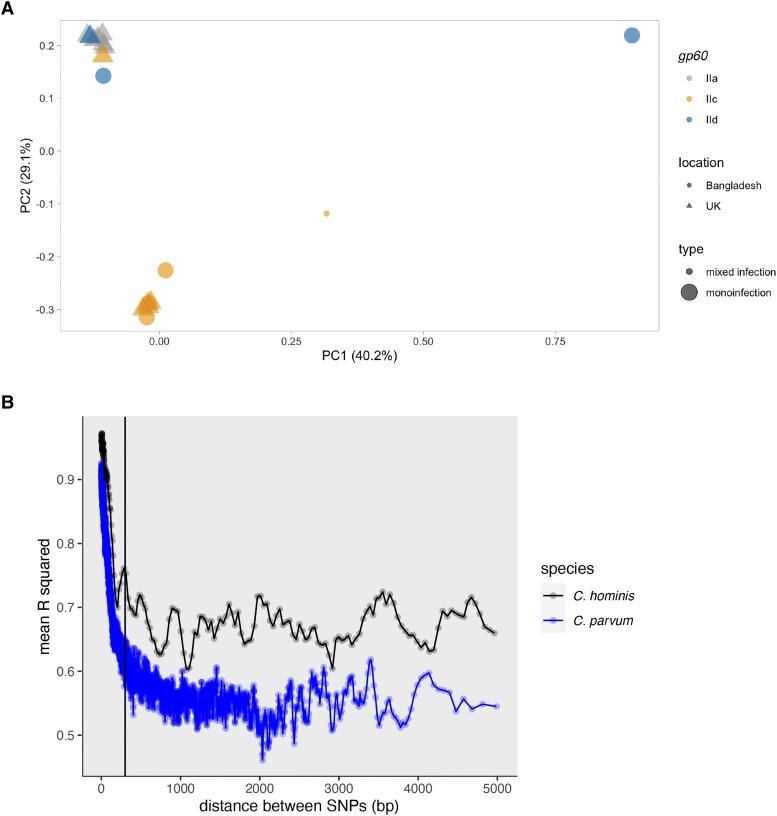
Figure 2.
Despite the rapid linkage disequilibrium decay observed in the Cryptosporidium parvum genome sequences the whole-genome SNP profile continued to be concordant with the gp60 genotype. A, gp60 summarizes genome-wide variation. Principal component (PC) analysis of genome-wide variation (as implemented in Plink 2.0) is shown. All quality-filtered single-nucleotide polymorphisms (SNPs) were used. Points represent genome sequences and are color coded by gp60 grouping. Shapes represent patient location. The small dot represents the mixed infection from Bangladesh. Significance as determined by a PERMANOVA: location, P > .5; gp60, P < .04; however, this statistical test is biased by outliers, and so please see Supplementary Figure 3. B, Similar rate of recombination in C. parvum when compared to Cryptosporidium hominis. Comparison between C. parvum (blue) and C. hominis (black) linkage disequilibrium decay, calculated with Plink 2.0. The region of linkage disequilibrium in C. hominis was previously calculated as being <300 and 300 bp is indicated by the vertical black line at 300 bp on the x-axis [7]. Although the threshold values were different in C. hominis and C. parvum the rate of linkage disequilibrium decay appeared similar. To confirm this observation the data were reanalyzed using comparable genome numbers (Supplementary Figure 4).

