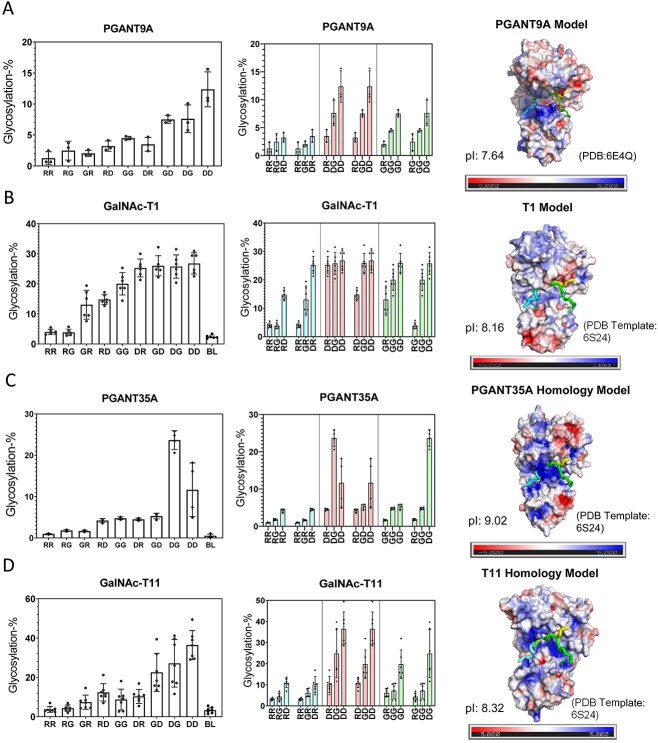
Fig. 10.
Charged peptide preferences and electrostatic distributions for the fly PGANT9A and PGANT35A, orthologues to hGalNAc-T1 and -T11. Transferase activity against the charged peptides in Table 1 (left and center columns) and transferase electrostatic surface potential (right column) for (A) PGANT9A, (B) GalNAc-T1, (C) PGANT35A, and (D) GalNAc-T11. See the legend of Fig. 2 for a full explanation of plots. These data show partial charge preference and electrostatic conservation to their mammalian orthologues in Fig. 2. See Materials and methods for details on the homology modeling and electrostatic charge calculations. Charged peptide glycosylation data for PGANT9A are taken from (May et al. 2020).

