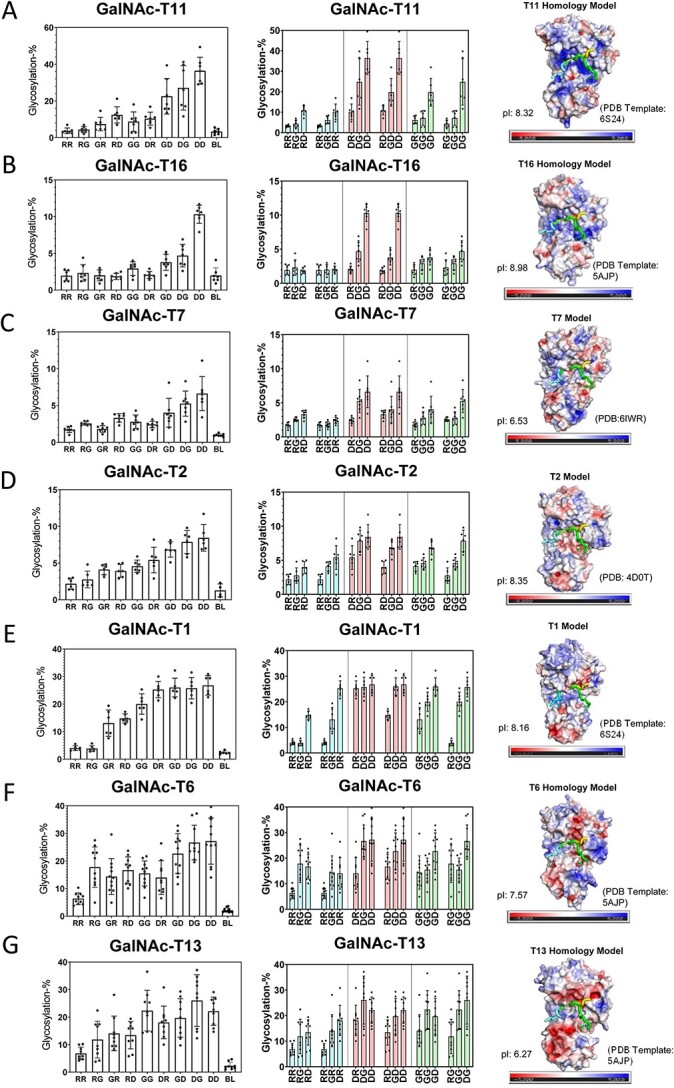
Fig. 2.

Negative charge preferring GalNAc-Ts and their electrostatic surface potentials. Shown are GalNAc-T activity against the charged peptides in Table 1 (left and center columns) and transferases electrostatic surface potential (right column). Transferases in (A)–(G) are ordered by decreasing negative charge specificity. Transferase activities (left panels) are shown for the library of peptides arranged from the left to right starting from the most positive RR peptide to the most negative DD peptide (see Table 1 for peptide abbreviations, BL represents no peptide control). These data are reordered in the middle panels such that either the N- or C-terminal charge remains constant, whereas the opposite C- or N-terminal charge varies from positive (R), neutral (G), to negative (D). These plots reveal the sensitivity of each GalNAc-T to systematic changes in N- or C- terminal charge. The blue bars correspond to fixed positive N- or C- terminal charge, red bars correspond to fixed negative N- or C- terminal charge, and green bars correspond to fixed neutral N- or C-terminal. GalNAc-T structures and electrostatic surface potentials (right panels). Negative charges are colored red, neutral colored white, and positive colored blue. Bound peptide substrates are oriented left to right N- to C-terminus and are shown as tube structures colored cyan, yellow, and green (taken from tgGalNAc-T3, PDB: 6S24,GalNAc-T2, PDB:2FFU, GalNAc-T2, PDB: 5AJP, respectively); also see Fig. 1. Isoelectric points are shown on the lower left of each structure panel. See Materials and methods for details on the homology modeling and electrostatic surface potential calculations.
