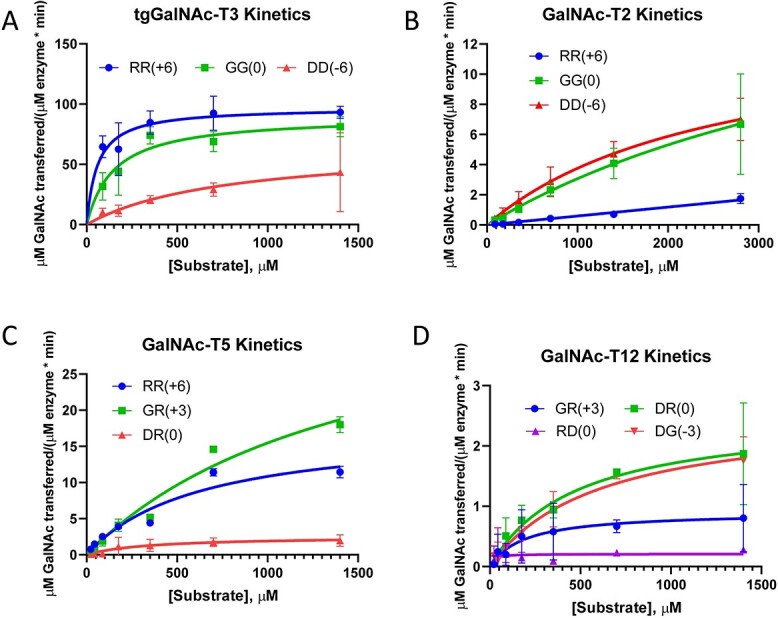
Fig. 5.

GalNAc-T charged peptide substrate kinetics. Plots for tgGalNAc-T3, GalNAc-T2, -T5, and -T12 (A-D) against selected charged peptide substrates of different relative activities. Data were analyzed and plotted using the Michaelis Menten module in GraphPad. Obtained km and kcat values are given in Table 2. Variations in kcat within a given GalNAc-T suggest different binding modes.
