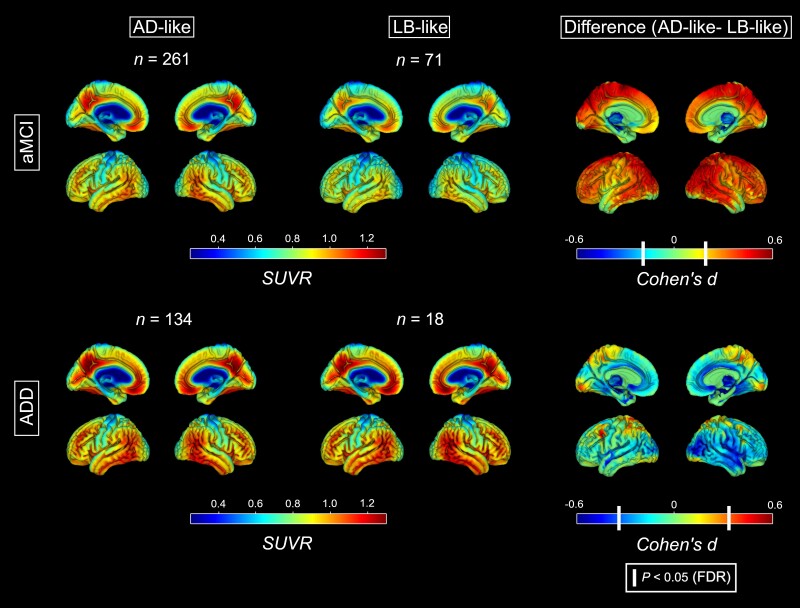
Figure 2.
Amyloid deposition maps for the AD-like and the LB-like groups. Standardized uptake value ratio (SUVR) maps of amyloid deposition calculated from Aβ-PET for the AD-like (left) and LB-like (centre) groups, stratified by aMCI (top) and ADD (bottom). Right: The voxel-wise analyses contrasting the AD-like and LB-like groups. White vertical bars in the Cohen’s d colour scales denote the effect sizes corresponding to a statistical threshold of P (FDR) < 0.05. AD = Alzheimer’s disease; ADD = Alzheimer’s disease dementia; aMCI = amnestic mild cognitive impairment; LB = Lewy body.

