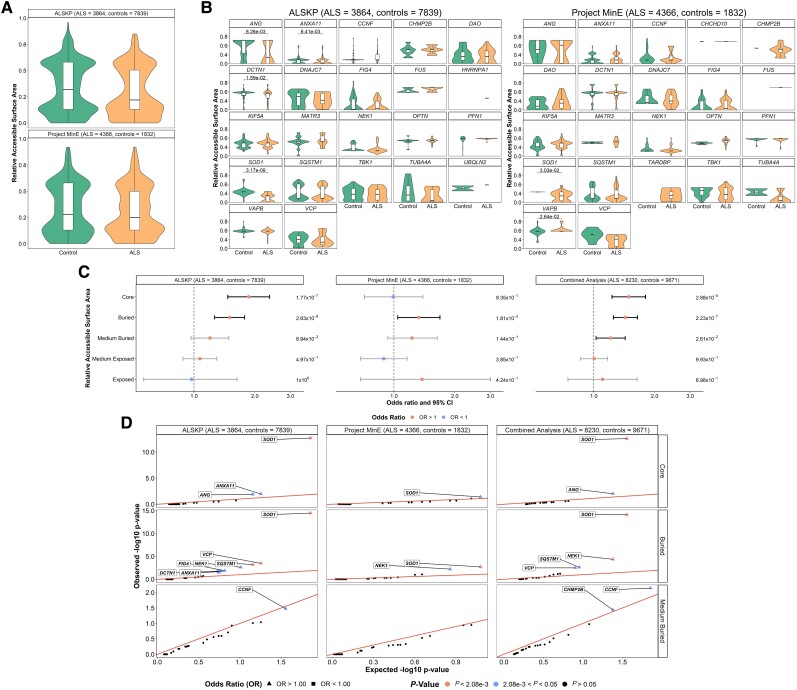
Figure 3.
Relative solvent accessible areas (RSAs) of rare missense variants identified across 24 ALS-associated genes. For all residues at which variants of interest were observed in the datasets, the AlphaFold predicted structures and DSSP (dictionary of protein secondary structure) program were used to derive RSAs. (A) A Wilcoxon rank sum test with continuity correction compared mean RSA of variants carried by the individuals with amyotrophic lateral sclerosis (ALS) and controls from the ALS Knowledge Portal (ALSKP) and Project MinE ALS sequencing consortium. Significant differences were not observed in either dataset (P-value = 0.142 and P-value = 0.1583, respectively). (B) Wilcoxon rank sum tests compared mean RSA of variants carried by the individuals with ALS and controls per gene. Significant P-values are displayed. Genes with <2 variant counts were excluded. (C) Enrichment analyses were performed using Fisher’s exact testing to compare the number of variants carried by individuals with ALS and controls of various RSA levels in the two datasets, followed by a Cochran–Mantel–Haenszel (CMH) test. Significance was measured at an alpha-level of 0.05. (D) Quantile-quantile plots of rare missense variants identified across 24 ALS-associated genes in the two datasets, defined by their RSA level. The RSA levels significantly enriched for missense variants in the individuals with ALS were further analysed to determine which genes were driving the enrichment of the features using Fisher’s exact testing. Enrichment of variants in the core was driven by SOD1 (ALSKP, P = 2.11 × 10⁻¹³; Project MinE, P = 3.96 × 10⁻²; combined analysis, P = 2.72 × 10⁻¹³) and ANG (ALSKP, P = 1.23 × 10⁻²; combined analysis, P = 9.73 × 10⁻³). Enrichment of variants in buried regions was driven by SOD1 (ALSKP, P = 3.38 × 10⁻¹⁵; Project MinE, P = 1.97 × 10⁻³; combined analysis, P = 7.71 × 10⁻¹⁵), NEK1 (ALSKP, P = 2.41 × 10⁻³; combined analysis, P = 4.39 × 10⁻⁵), SQSTM1 (ALSKP, P = 6.13 × 10⁻⁴; Project MinE, P = 1.97 × 10⁻³; combined analysis, P = 1.69 × 10⁻⁵) and VCP (ALSKP, P = 3.26 × 10⁻⁴; combined analysis, P = 3.12 × 10⁻³). An alpha-level of 2.08 × 10⁻³ was considered significant following Bonferroni correction accounting for the 24 genes analysed. Solvent area levels were defined as: core, RSA < 5%; buried, 5% < RSA < 25%; medium-buried, 25% < RSA < 50%; medium-exposed, 50% < RSA < 75%; and exposed, RSA > 75%.

