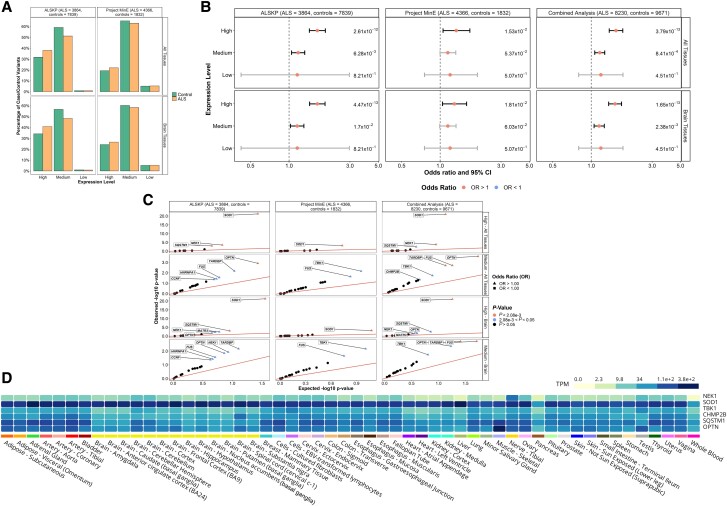
Figure 6.
Expression levels of rare missense variants identified across 24 ALS-associated genes. (A) Distribution of expression levels across all tissues and in brain tissues of all missense variants found in the ALS Knowledge Portal (ALSKP) and Project MinE sequencing consortium datasets were identified. (B) Enrichment analyses were performed using Fisher’s exact testing to compare expression levels across all tissues and in brain tissues of variants carried by individuals with ALS and controls in the two datasets, followed by a Cochran–Mantel–Haenszel (CMH) test. Expression levels were defined as: low, mean expression < 0.1; medium, mean expression ≥ 0.1 and ≤ 0.9; and high, mean expression > 0.9. Significance was measured at an alpha-level of 0.05. (C) Quantile-quantile plots of missense variants identified across the 24 ALS-associated genes, defined by their expression level in brain tissues and all tissues. The expression levels significantly enriched for variants of interest in the individuals with ALS compared to the controls from the ALSKP and Project MinE ALS datasets were further analysed to determine which genes were driving the enrichment of the features using Fisher’s exact testing. Enrichment of variants with high expression in all tissues was driven by SOD1 (ALSKP, P = 5.64 × 10⁻²²; Project MinE, P = 6.60 × 10⁻⁴; combined analysis, P = 9.70 × 10⁻²²), NEK1 (ALSKP, P = 3.22 × 10⁻⁴; combined analysis, P = 1.52 × 10⁻⁴) and SQSTM1 (ALSKP, P = 1.04 × 10⁻³; combined analysis, P = 3.30 × 10⁻³); and enrichment of variants with medium expression in all tissues was driven by OPTN (ALSKP, P = 1.22 × 10⁻³; combined analysis, P = 2.60 × 10⁻⁴), FUS (ALSKP, P = 2.79 × 10⁻²; Project MinE, P = 2.27 × 10⁻²; combined analysis, P = 1.94 × 10⁻³) and TARDBP (ALSKP, P = 6.80 × 10⁻³; combined analysis, P = 1.96 × 10⁻³). Similarly, enrichment of variants with high expression in brain tissues was driven by SOD1 (ALSKP, P = 5.64 × 10⁻²²; Project MinE, P = 6.60 × 10⁻⁴; combined analysis, P = 9.70 × 10⁻²²); and enrichment of variants with medium expression in brain tissues was driven by FUS (ALSKP, P = 2.79 × 10⁻²; Project MinE, P = 2.27 × 10⁻²; combined analysis, P = 1.94 × 10⁻³), TARDBP (ALSKP, P = 6.80 × 10⁻³; combined analysis, P = 1.96 × 10⁻³) and OPTN (ALSKP, P = 1.44 × 10⁻²; combined analysis, P = 4.36 × 10⁻³). An alpha-level of 2.08 × 10⁻³ was considered significant following Bonferroni correction accounting for the 24 genes analysed. (D) Average expression of the genes identified as driving enrichment of variants with medium and high expression in the brain and all tissues in individuals with ALS compared to controls based on data from the Genotype-Tissue Expression (GTEx) Portal.

