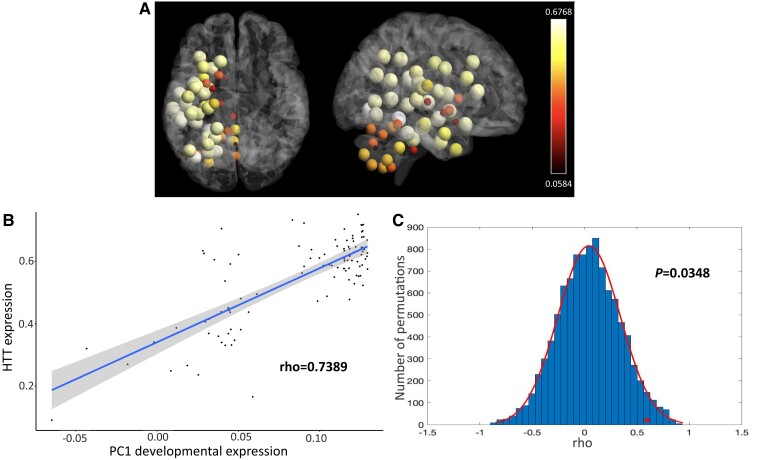
Figure 6.
Association between HTT expression and developmental genes. Average expression of the HTT in the Allen Human Brain Atlas (AHBA), left hemisphere only (n = 6). Expression normalized with the Abagen toolbox and depicted in the Desikan (cortical and subcortical) and Diedrichesen (cerebellar) atlases using BrainNet Viewer (A). The genes involved in early brain development obtained from Kang et al.41 and also present in the AHBA dataset were: CYP26A1, FBXW7, MCHR2, OSTN, PART1, RORB, SATB2, SSX2IP, TMS6SF1 and TSHZ3. The correlation between HTT expression from the AHBA and the first component of the expression of developmental genes is shown in B. In C, the distribution of the correlations between HTT expression and the first principal components component of the expression of random sets of 10 genes from the AHBA through bootstrapping (resampling 10 000 times) is represented. The red circle illustrates the association between HTT expression and correlation with the first principal components analysis component of developmental genes from Kang et al.41 The y-axis represents the number of permutations of random genes from the AHBA list. The x-axis represents the correlation coefficients.

