Figure 1.
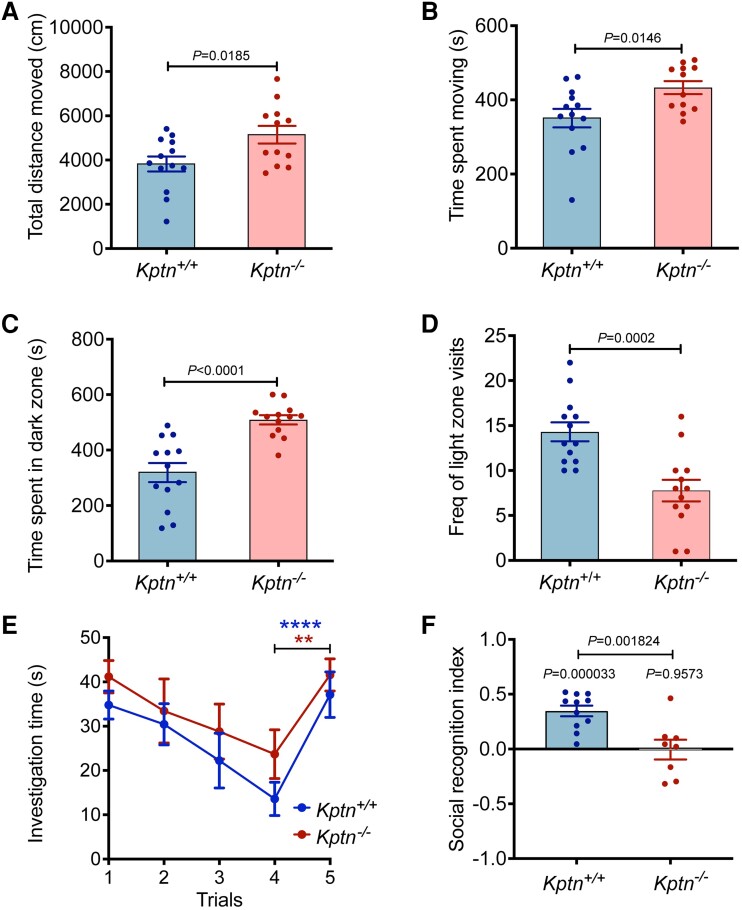
Assessing Kptn −/− mice for changes in activity, anxiety and memory. Kptn−/− mice were tested for locomotor activity (A and B) altered anxiety-like behaviour (C and D) and memory retention (E and F). (A and B) Changes in behaviour in the open field assay of Kptn−/− mice (n = 12) compared to wild-type controls (Kptn+/+, n = 13). (A) Distance covered (P = 0.0185, t = 2.534 df = 23, two-tailed Student’s t-test); (B) time spent moving (P = 0.0146, t = 2.64 df = 23, two-tailed Student’s t-test). (C and D) Results of anxiety testing using a light/dark box, comparing Kptn−/− mice (n = 13) and wild-type controls (Kptn+/+, n = 13). (C) Time spent in the dark zone (P < 0.0001; t = 4.946 df = 24, two-tailed Student’s t-test) and (D) frequency of visits to light zone (P = 0.0002, t = 4.326 df = 25, two-tailed Student’s t-test). (E) Memory testing using social recognition assay, measuring investigation time on Day 1 by wild-type controls (Kptn+/+n = 11) and Kptn mutant mice (Kptn−/−, n = 8) of a stimulus animal repeatedly presented to them over the course of four trials. To assess the ability to discriminate novel from familiar mice, in Trial 5 all animals are presented with a novel stimulus animal (change in investigation Trials 1–4 versus Trial 5, two-way ANOVA, interaction Trial × Genotype F(4,68) = 0.3852, P = 0.8185; Trial F(4,68) = 16.26, P < 0.0001; post hoc analysis of Trial 4 versus Trial 5, Kptn+/+P < 0.0001****, Kptn−/−P = 0.0023**). (F) Assessment of 24 h social recognition memory using the social recognition index, which indicates the difference in investigation of unfamiliar stimulus versus the familiar stimulus mouse (from Day 1) as a fraction of total investigation time (see ‘Materials and methods’ section) for wild-type Kptn+/+ controls (n = 11), and Kptn−/− mice (n = 8) (between genotypes, two-tailed Student’s t-test; within genotypes, one sample two-tailed Student’s t-tests against mean of zero).Values are plotted as mean ± standard error of the mean (SEM).

