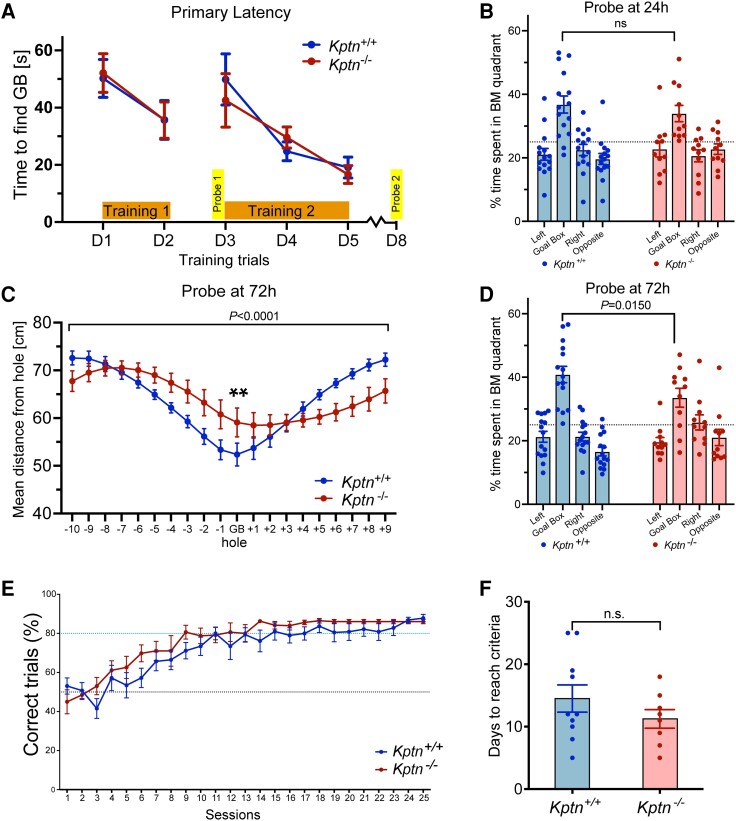
Figure 2.
Performance of Kptn−/− mice in memory assays. (A–D) Barnes maze applied to KRD mouse model to assess spatial memory. (A) Time taken to find the escape box (primary latency) across all days of training (Training 1, D1–D2; Training 2, D3–D5), comparing Kptn+/+ (n = 15) and Kptn−/− (n = 11) mice [two-way ANOVA, interaction Genotype × Zone F(4,120) = 0.2577, P = 0.9044]. (B) The percentage of time Kptn+/+ (blue, n = 15) and Kptn−/− (red, n = 11) mice spent around the target hole quadrant (Goal Box) and non-target quadrants of the Barnes maze during a probe trial 24 h after Training 1 [two-way ANOVA, interaction Genotype × Zone F(3,96) = 0.8544, P = 0.4676]. Both genotypes spent significantly more time near the target versus all other holes (post hoc FDR q < 0.0003. P ≤ 0.001). (C) The mean distance from each hole during probe trial, 72 h after Training 2, comparing Kptn−/− and Kptn+/+ mice [two-way ANOVA, interaction Genotype × Hole F(19,500) = 5.351, P = <0.0001; post hoc on GB, FDR q = 0.0045, P = 0.0014**]. (D) The percentage of time Kptn+/+ (blue, n = 15) and Kptn−/− (red, n = 11) mice spent in the target hole quadrant (Goal Box) and non-target quadrants of the Barnes maze during the probe trial, 72 h after Training 2, comparing time in the target hole quadrant between Kptn−/− and Kptn+/+ mice [two-way ANOVA, interaction Genotype × Zone F(3,96) = 3.667, P = 0.0150; post hoc FDR q = 0.0632, P = 0.0150] (E and F) Assessment of Kptn−/− mice in hippocampus-independent pairwise discrimination task (Bussey-Saksida chamber). (E) Percentage of correct trials (when CS+ image was nose-poked) out of the total trials completed per session for Kptn−/− (n = 8) and Kptn+/+ (n = 10) mice [two-way ANOVA, interaction Genotype × Session F(1,16) = 1.144, P = 0.3007]. (F) Number of days to reach criteria comparing Kptn−/− and Kptn+/+ mice (P = 0.2093, t = 1.162 df = 16, two-tailed Student's t-test). Values are plotted as mean ± standard error of the mean (SEM).

