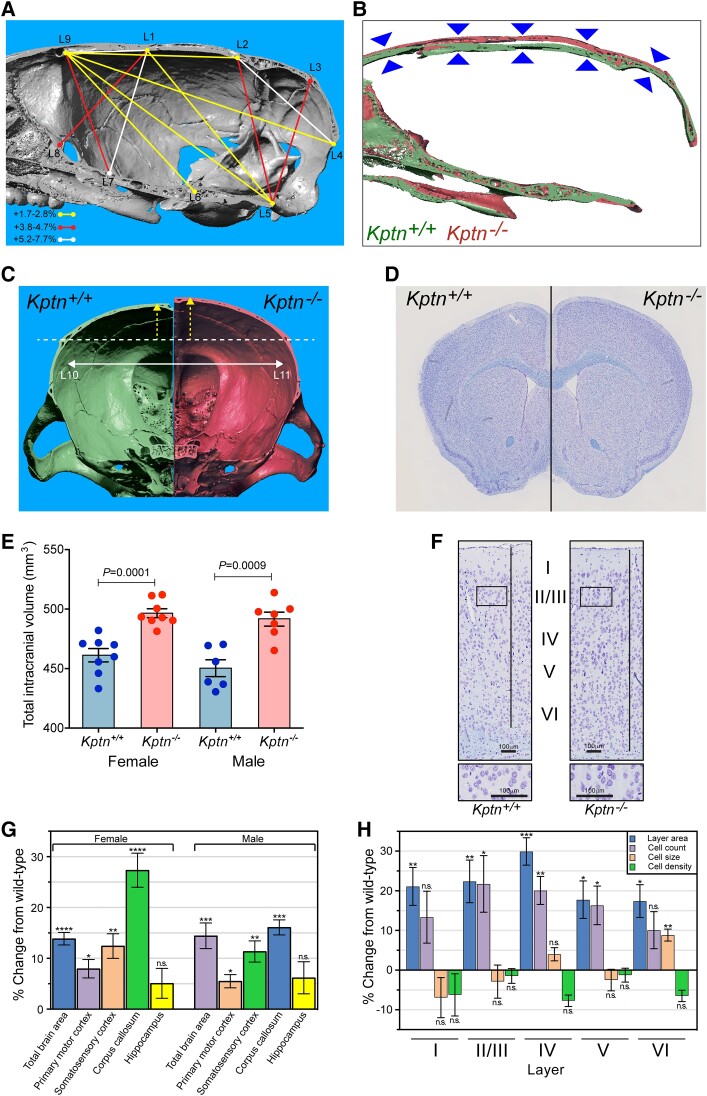
Figure 4.
Assessing Kptn−/− mouse model skull and brain morphology. Micro-computed X-ray tomography reconstructions were collected and analysed on male Kptn−/− mice and Kptn+/+ controls (n = 5 each). (A) Significant changes in inter-landmark distances are indicated with lines (colours represent bins of % change from wild-type) for height, length and width of the brain cavity of Kptn−/− animals (P < 0.05, two-tailed Student's t-test, Supplementary Table 1). (B) Sagittal sections of 3D reconstructions comparing skull height along the rostro-caudal extent of the brain cavity (arrowheads). (C) Anterior-facing coronal sections from representative individual 3D reconstructions to highlight changes in the dorsal curvature (yellow arrows) of frontal and parietal bones in Kptn−/− mice (left, green = Kptn+/+, right, red = Kptn−/−), and the width of the brain cavity (white arrow, +2.56%, P = 0.0356). (D) Representative hemisections of male Kptn+/+ control (left) and Kptn−/− mutant brains (right). (E) Volumetric measurements from MRI of female and male Kptn−/− mutants and Kptn+/+ controls comparing total intracranial volume at 16 weeks of age (n = 8 per group, two-tailed Student's t-tests). Values are plotted as mean ± standard error of the mean (SEM). (F) Representative sections from Kptn+/+ and Kptn−/− cortices stained with cresyl violet. (G) Morphometric analyses of histological sections (as in D and F) of Kptn−/− mutant brains plotted as percentage difference of Kptn−/− from wild-type mean, to identify significant changes in total brain area (shown for Section 1), cortical (shown for Section 1) and corpus callosum thicknesses (Section 2) (P-values as described below, two-tailed Student's t-tests, further details in Supplementary Fig. 5 and Supplementary material, File 1). (H) Cellular features for each cortical layer (layer I to layer VI) in Kptn−/− mutant mice (cell count, cell size, cell density) as well as the corresponding layer area (Supplementary material, File 1) at position Bregma −1.34 mm in male mice, shown as a percentage difference of Kptn−/− from wild-type mean. n.s. = no significant change (P > 0.05); *P < 0.05; **P < 0.01; ***P < 0.001; ****P < 0.0001.

