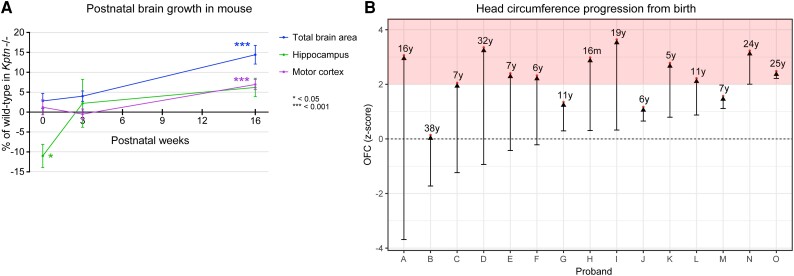
Figure 5.
Assessment of postnatal brain overgrowth in mouse KRD model and human KRD probands. (A) Percentage change in mean of total brain area, motor cortex and hippocampus in Kptn−/− mutant mice compared to wild-types at birth, 3 weeks and 16 weeks postnatally, with significance level indicated by asterisks in graph. Points without asterisks are not significantly different (P > 0.05, two-tailed Student's t-test). (B) Occipital frontal circumference (OFC) measurements from 15 individuals with KRD from birth (lower bars) to age at last assessment (red dots). Pink shading in B indicates the macrocephalic range, with SD >2.

