Figure 6.
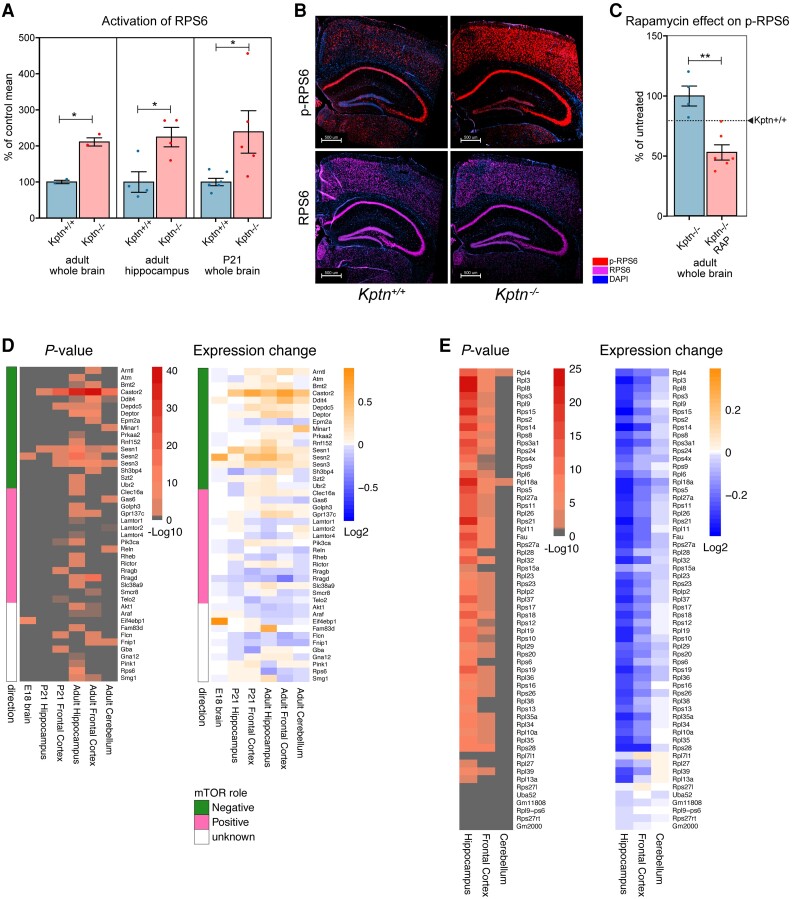
Assessing Kptn loss-of-function effects on mTOR signalling. (A) Quantification of the phosphorylation of ribosomal protein S6 (RPS6) in wild-type controls (Kptn+/+) and mutant animals (Kptn−/−) to test for alterations in mTOR signalling in adult whole brain (P = 0.0119, n = 2 per genotype), hippocampus (P = 0.0189, n = 4 per genotype), and in whole brains of juvenile mice at P21 (P = 0.0308, Kptn+/+, n = 6; Kptn−/−, n = 5), measured as the ratio of phosphorylated RPS6 (p-RPS6) to total RPS6 signal (units as % of control mean). All P-values are from two-tailed Student's t-tests. (B) Immunostaining for RPS6 (purple) and its phosphorylated form (p-RPS6, red) to reveal changes in cortical and hippocampal activation of the mTOR pathway in Kptn−/− mice (nuclei stained with DAPI, blue). (C) Quantification of the phosphorylation of RPS6 in Kptn−/− animals after 3 days of treatment with vehicle (Kptn−/−) or rapamycin (Kptn−/− RAP) to detect changes in p-RPS6 levels upon treatment (P = 0.00188, Kptn+/+n = 4; Kptn−/−n = 6, two-tailed Student's t-test). Values are plotted as mean ± SEM, as a percentage of vehicle treated Kptn−/− mice. Wild-type levels are indicated by the dashed line and arrowhead (Kptn+/+). (D and E) Bulk RNA-Seq reveals transcriptional changes to mTOR pathway components (D) and downstream ribosomal gene network (E) in Kptn−/− mice at embryonic and postnatal stages as indicated, compared to Kptn+/+ controls. Statistically significant (α < 0.05) Log2-fold changes in expression are indicated by non-grey adjusted P-value heat map cells. Role in mTOR pathway is indicated as green/pink/white colour scheme in D. All western blot images can be found in Supplementary material, File 5.

