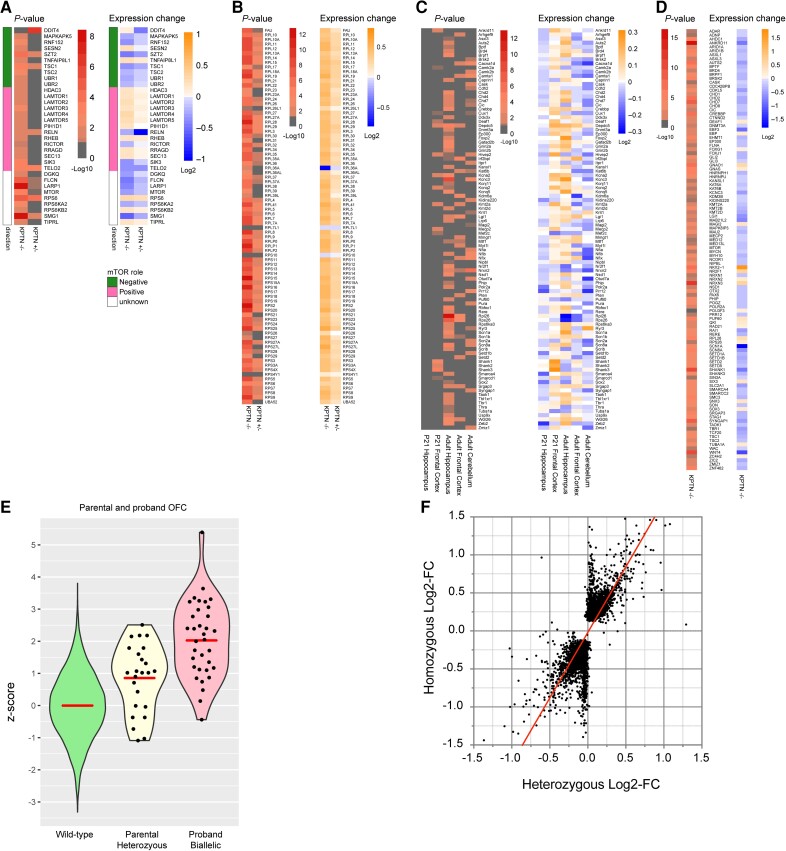
Figure 7.
Assessing transcriptional changes in mTOR pathway and developmental disorder genes in human neural stem cell model of KRD, and morphological correlates of KPTN dosage sensitivity. (A and B) Transcriptional changes in mTOR pathway components (A) and downstream ribosomal gene network (B) in KPTN LoF NPC models compared to wild-type controls. Heterozygous KPTN LoF cells (KPTN+/−) were included to look for the presence of any intermediate mTOR pathway phenotypes consistent with dosage sensitivity to loss of KPTN expression. (C and D) Dysregulation of dominant haploinsufficient developmental disorder associated genes in mouse brain (C) and human neural cell models of KRD (D). Statistically significant Log2-fold changes in expression are indicated by non-grey adjusted P-value heat map cells. (E) Occipitofrontal circumference (OFC) measurements in heterozygous parents (Parental Heterozygous) of KRD probands (mean z-score = 0.856, P = 0.000028, one sample, two-sided z-test against wild-type distribution, n = 24) alongside the wild-type OFC distribution (Wild-type) and that of affected individuals with biallelic KPTN variants (Proband Biallelic, as detailed in Supplementary material, File 2; Proband, mean z-score = 2.027, P < 0.00001, one sample, two-sided z-test against wild-type distribution, n = 35). (F) Comparison of normalized read counts from RNA-Seq on KPTN LoF NPC models to examine correlation between the gene dysregulation in homozygous and heterozygous KPTN LoF cell lines (Pearson r = 0.759, P < 0.0001).

