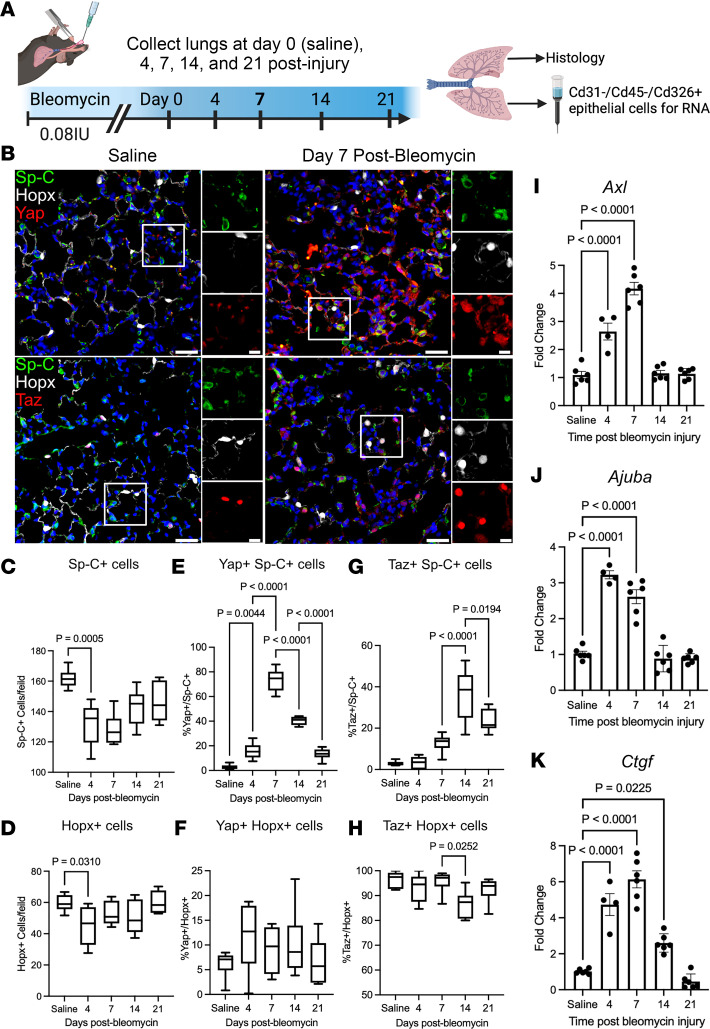
Figure 1. YAP/TAZ are dynamically regulated during acute bleomycin lung injury.
(A) Schematic of injury model and time points when lungs were assessed. (B) Immunofluorescence analysis of Yap or Taz (red) in Sp-C+ (green) AT2 and Hopx+ (white) AT1 cells. (C and D) Quantification of Sp-C+ AT2 and Hopx+ AT1 cells at respective injury repair time points. (E and F) Quantification of Yap+ nuclei in Sp-C+ AT2 and Hopx+ AT1 cells. (G and H) Quantification of Taz+Sp-C+ AT2 and Hopx+ AT1 cells. Scale bars: 50 µm, 10 µm (insets). In box-and-whisker plots, whiskers are minimum and maximum, and data represent n = 6 mice. (I, J, and K) qPCR analysis of Yap/Taz target genes Axl (I), Ajuba (J), and Ctgf (K) during bleomycin injury repair. n = 6 mice for saline, 7, 14, and 21 days after injury and n = 4 mice at day 4. Data are shown as mean ± SEM. Statistical analysis was performed using 1-way ANOVA and Tukey’s post hoc comparison.

