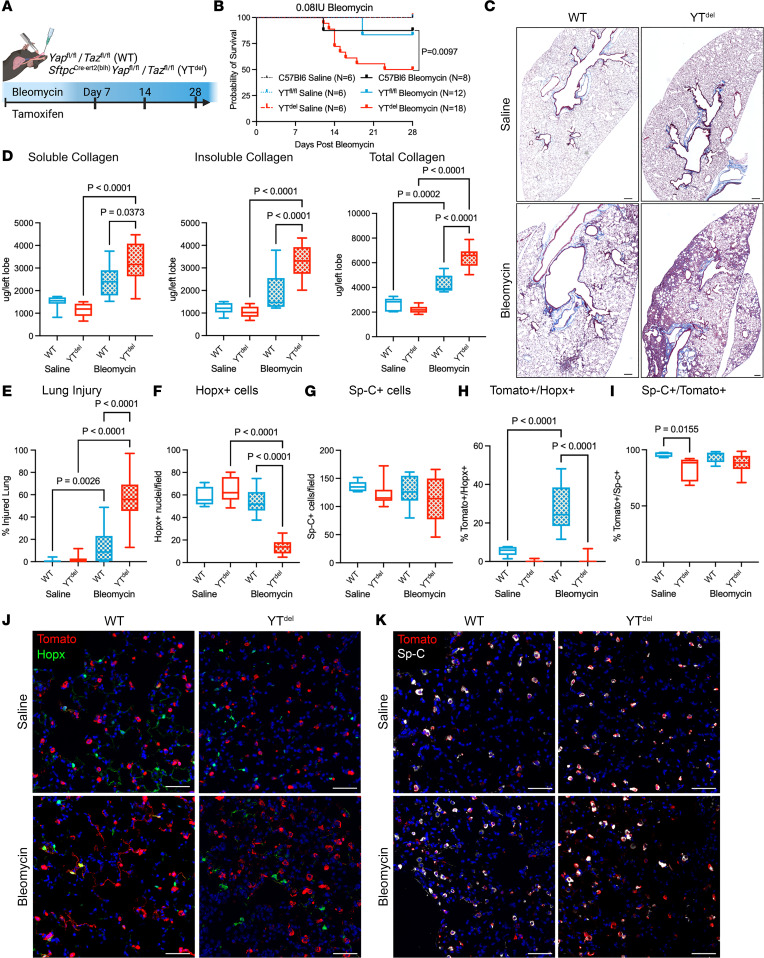
Figure 2. Deletion of YAP/TAZ leads to failed alveolar repair following single-dose bleomycin induced lung injury.
(A) Schematic of injury model in which mice were treated with tamoxifen the same day as bleomycin-induced lung injury. (B) Survival curve of WT and YTdel bleomycin- or saline-treated mice out to 28 days after injury. Statistics determined using Mantel-Cox test. (C) Masson’s trichrome staining of tissue sections from WT and YTdel mice at day 28 after bleomycin or PBS. (D) Soluble, insoluble, and total collagen quantification from WT and YTdel at day 28 after saline or bleomycin. (E) Quantification of total injured lung area in respective groups at day 28 after saline/bleomycin. n = 7 WT saline, n = 9 YTdel saline, n = 9 WT bleomycin, and n = 12 YTdel bleomycin mice. (F and G) Quantification of total Hopx+ cells or Sp-C+ cells per 20× field of view in each group. n = 10 WT saline-, n = 9 YTdel saline-, n = 12 WT bleomycin-, and n = 18 YTdel bleomycin-treated mice. (H and I) Quantification of Sp-Ctomato lineage–labeled Hopx+ or Sp-C+ AT2 cells 28 days after bleomycin. (J) Immunofluorescence analysis of Sp-Ctomato lineage labeled cells (red) and Hopx+ (green) AT1 cells at 28 days after injury. (K) Immunofluorescence analysis of Sp-Ctomato lineage–labeled cells (red) and Sp-C+ (white) AT2 cells at 28 days after injury. n = 5 WT saline, n = 5 YTdel saline, n = 10 WT bleomycin, and n = 15 YTdel bleomycin mice. Scale bars: 200 µm (C), 50 µm (J and K). Statistical analysis in D–I was performed using 1-way ANOVA and Tukey’s post hoc comparison.

