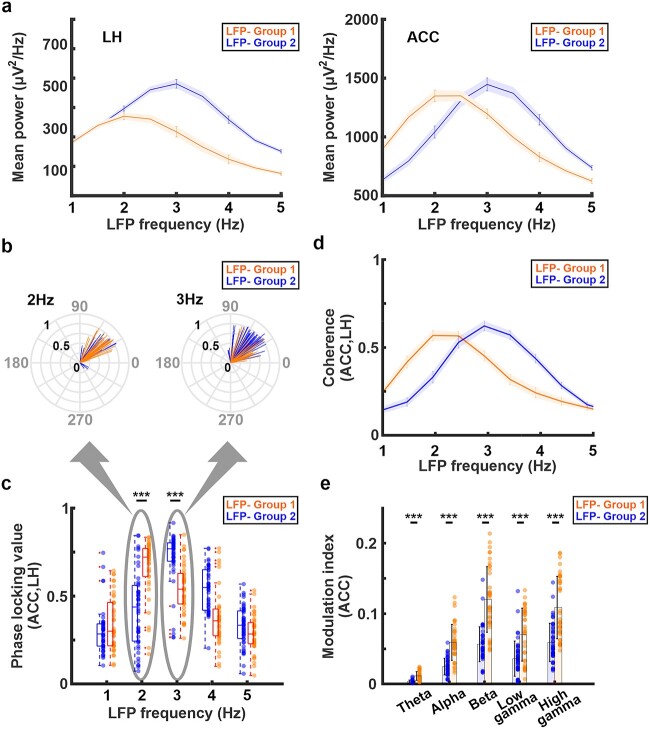
Fig. 2.
a) Power spectrum density of the LH (left) and ACC (right) in LFP-group 2 (blue line) and LFP-group 1 (orange line). The shaded areas represent the standard error of the mean. The peak frequency in both LH and ACC is at 3 Hz in LFP-group 2 (blue line) but at 2 Hz in LFP-group 1 (orange line). b) The radial plots of the trial-specific phase angles ([degrees], gray) and phase-locking value (black) between LH and ACC at 2 Hz and 3 Hz in LFP-group 1 (orange) and LFP-group 2 (blue). c) Phase locking value between the LH and ACC in both groups. The highest phase synchrony occurred at 3 Hz in LFP-group 2 (blue) but at 2 Hz in LFP-group 1 (orange). d) Magnitude squared coherence between LH and ACC. The highest coherence occurred at 3 Hz in LFP-group 2 (blue) but at 2 Hz in LFP-group 1 (orange). The shaded areas represent the standard error of the mean. e) Phase-amplitude coupling using the modulation index (MI) at the ACC between the phase of delta (1–4 Hz) band and amplitude of other frequency bands. The MI in LFP-group 1 (orange) is higher than LFP-group 2 (blue) on all frequency bands. Error bars indicate the standard deviation. Note: ***P < 0.001, **P < 0.01, *P < 0.05.

