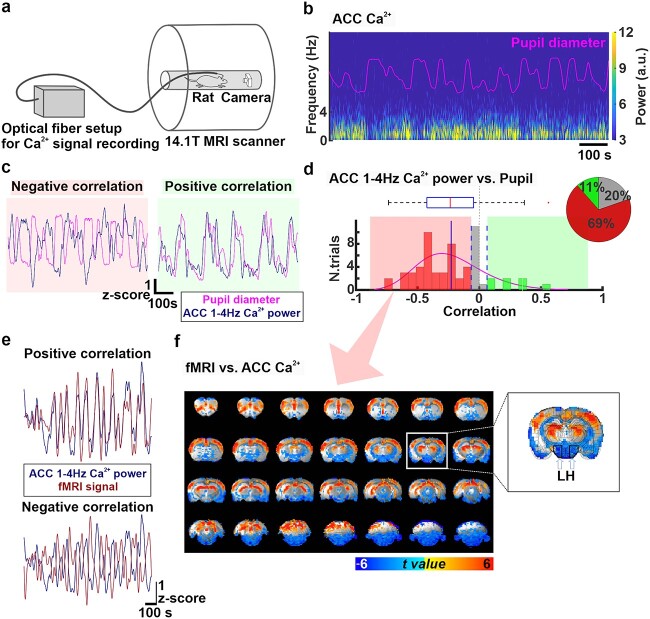
Fig. 3.
a) The experimental setup for multimodal resting-state BOLD fMRI recordings simultaneously with measurements of optical fiber Ca2+ signals and pupil dynamics. b) Power spectrum of ACC Ca2+ signals during 15 min of resting-state along with changes in pupil diameter (pink trace) in a representative rat. A.u: Arbitrary units. c) Examples of positive (right, green) and negative (left, red) correlations between pupil dynamics (pink) and ACC 1–4 Hz Ca2+ power fluctuation (navy blue) during 15 min of resting state. d) Distribution of correlation coefficients between pupil dynamics and ACC 1–4 Hz Ca2+ power fluctuation for all trials (n = 61, 10 animals). These correlation coefficients are negative (correlation coefficient < −0.064) in 69% (n = 42, red), none (−0.064 < correlation coefficient < 0.064) in 20% (n = 12, gray), and positive (correlation coefficient > 0.064) in 11% (n = 7) of the trials. The pie chart represents ratios of the positive, no, and negative correlations. e) Examples of positive and negative correlation between fMRI signal (brown) and ACC 1–4 Hz Ca2+ power (navy blue) fluctuations during 15 min of resting state. f) t-value maps of correlation between ACC 1–4 Hz Ca2+ power and each fMRI voxel when ACC 1-4 Hz Ca2+ power fluctuation and pupil dynamics were negatively correlated during 15 min of resting state (n = 42.69%). The overlay shows voxels with t-value < −2.25 and t-value > 2.25. A coronal slice at coordinates A/P = −3.2 mm is shown magnified on the right, where the location of the LH is indicated with white arrows and black polygons.

