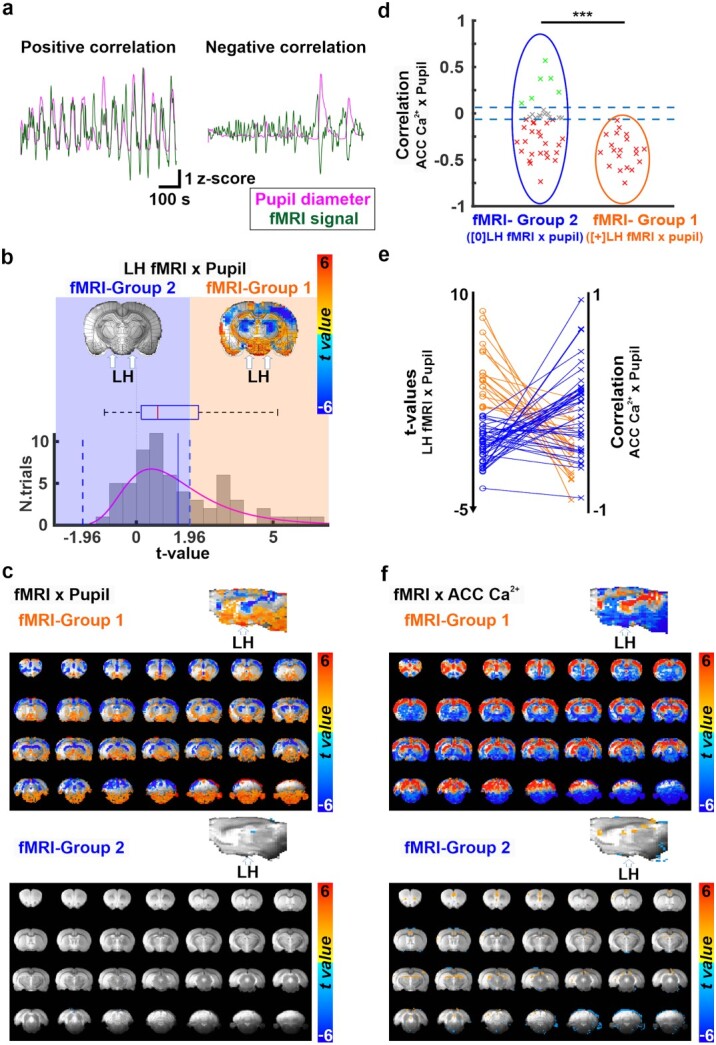
Fig. 4.

a) Examples of positive (left) and negative (right) correlations between pupil dynamics (pink) and fMRI signal fluctuations (green) during 15 min of resting state. b) The representation of two distinct brain states. Trials are sorted into two groups characterized by positive (fMRI-group 1) or no (fMRI-group 2) correlation between the LH BOLD fMRI signal and the pupil size fluctuations. On the top, two fMRI-pupil correlation maps at A/P = −3.2 mm from fMRI-group 1 and 2 are shown. The location of LH is indicated with a white arrow. The bottom graph represents the t-value distribution of the LH-fMRI and pupil dynamics correlations across all trials (n = 61), on which the state differentiation is based. fMRI-group 1 (positive correlation) was observed in 33% of the trials (n = 20, t > 1.96), and fMRI-group 2 (no-correlation) in 67% of trials (n = 41, t < 1.96). c) Whole-brain maps and their sagittal plane view of the correlation between fMRI and pupil dynamics from trials associated with fMRI-group 1 (top) and 2 (bottom). d) Correlation coefficients between pupil dynamics and ACC 1–4 Hz Ca2+ power fluctuation sorted by fMRI-group 1 (orange ellipse) and 2 (blue ellipse). The thresholds of correlation coefficients are set at +/− 0.064. e) the plot shows the correspondence between two kinds of analysis in the same data: Correlation t-values between LH-fMRI and pupil (left) and the correspondent ACC 1–4 Hz Ca2+ power and pupil dynamic correlation for each trial (right). The color indicates the groups (orange for fMRI-group 1 and blue for fMRI-group 2) associated with each trial. f) t-value whole-brain maps showing the correlation between fMRI and ACC 1–4 Hz Ca2+ power from trials assigned to fMRI-group 1 (top) and 2 (bottom). The overlay shows voxels with t-value < −2.54 and t-value > 2.54. Note: ***P < 0.001, **P < 0.01, *P < 0.05.
