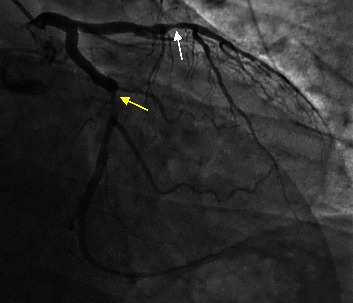
Figure 1.

Obstructive coronary artery disease demonstrated on the coronary angiogram. Obstructive coronary artery disease was seen after 18 months of lenvatinib therapy. The coronary angiogram demonstrated mid-LAD with ∼90% stenosis (white arrow) (treated by placing two DES), moderate distal LAD disease, mid-LCx with ∼90% stenosis (yellow arrow) (treated by placing one DES), and distal left circumflex disease. LAD = left anterior descending artery; LCx = left circumflex artery; DES = drug-eluting stent.
