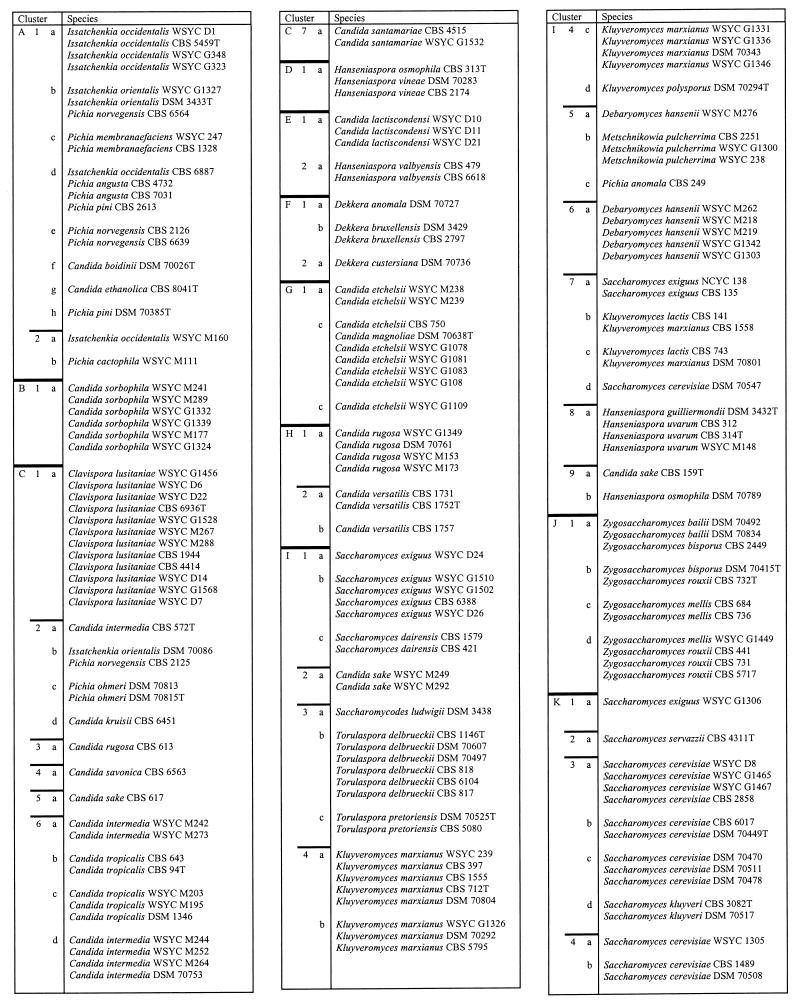
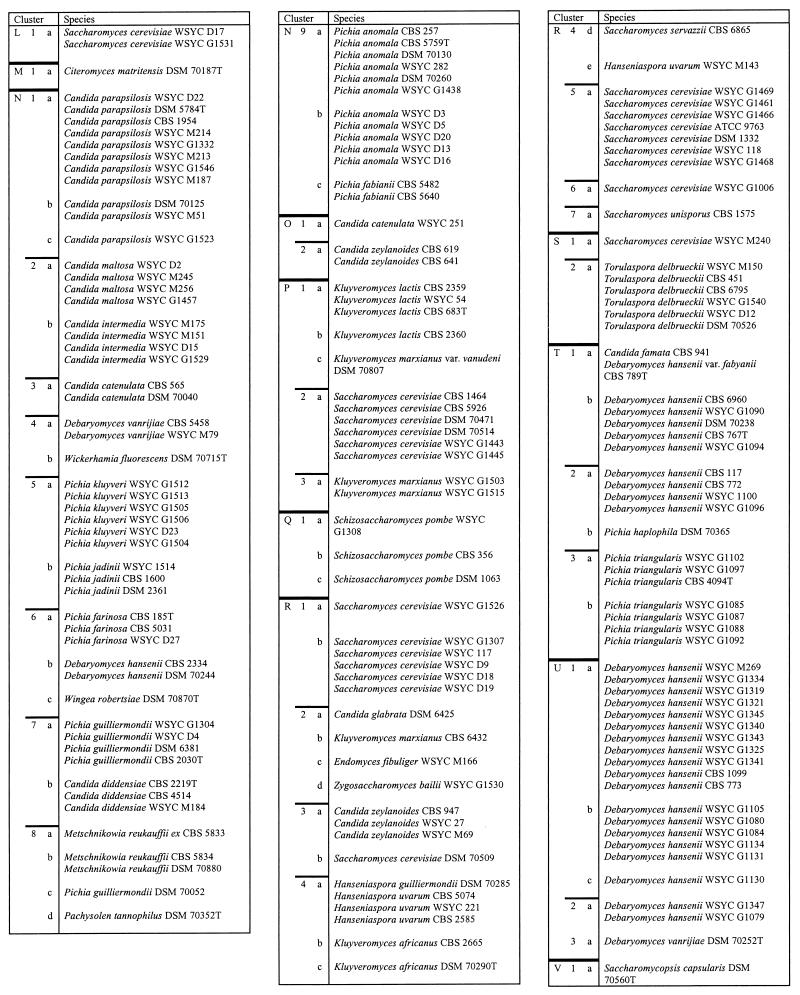
TABLE 2.
The 322 yeast strains used to create the FT-IR reference spectrum librarya
The arrangement of strains in clusters is in accordance with Fig. 1. For abbreviations used in strain designations, see footnote a to Table 1. T, type strain. The cluster designations indicate spectral distances as follows: for A to V, d = 2.0 to 2.5; for 1 to 9, d = 1.25 to 1.75; for a to h, d = 0.5 to 0.75.


