Figure 2.

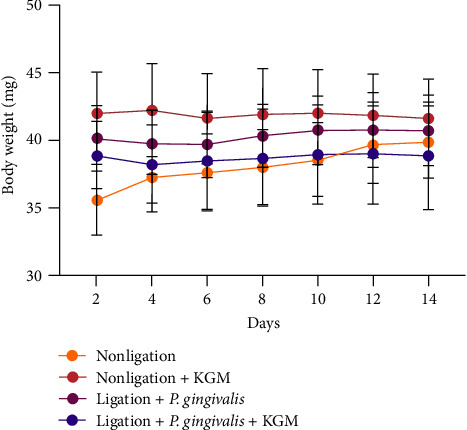
Body weight observation during the study. Data were presented as mean ± standard deviation in milligrams (mg) (n = 12 sample/group). ANOVA was used for comparisons between the groups.

Body weight observation during the study. Data were presented as mean ± standard deviation in milligrams (mg) (n = 12 sample/group). ANOVA was used for comparisons between the groups.