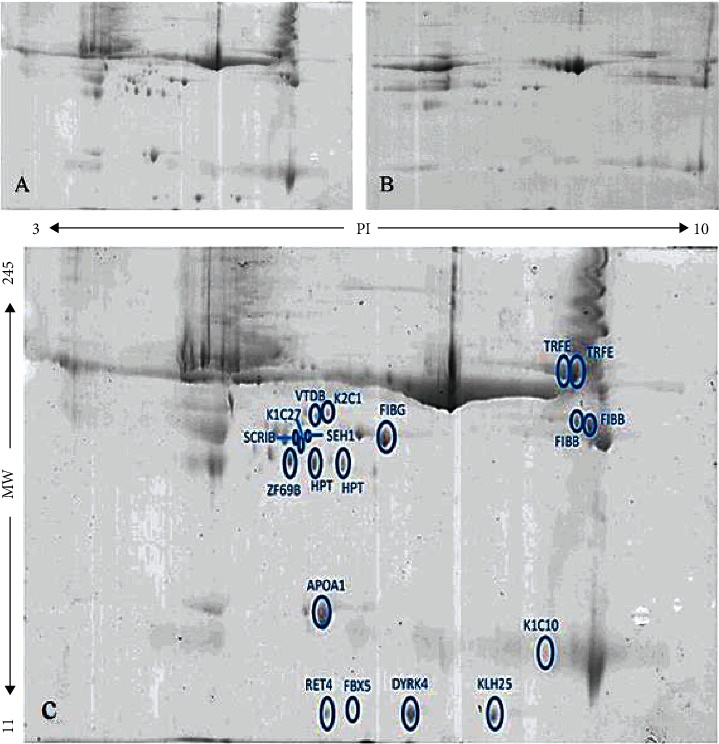
Figure 1.

The protein profile of chronic ITP samples separated by two-dimensional gel electrophoresis (2-DE): (A) respondents; (B) nonrespondents. (C) Nineteen differentially expressed protein spots identified by Progenesis SameSpots software (2-DE image analysis).
