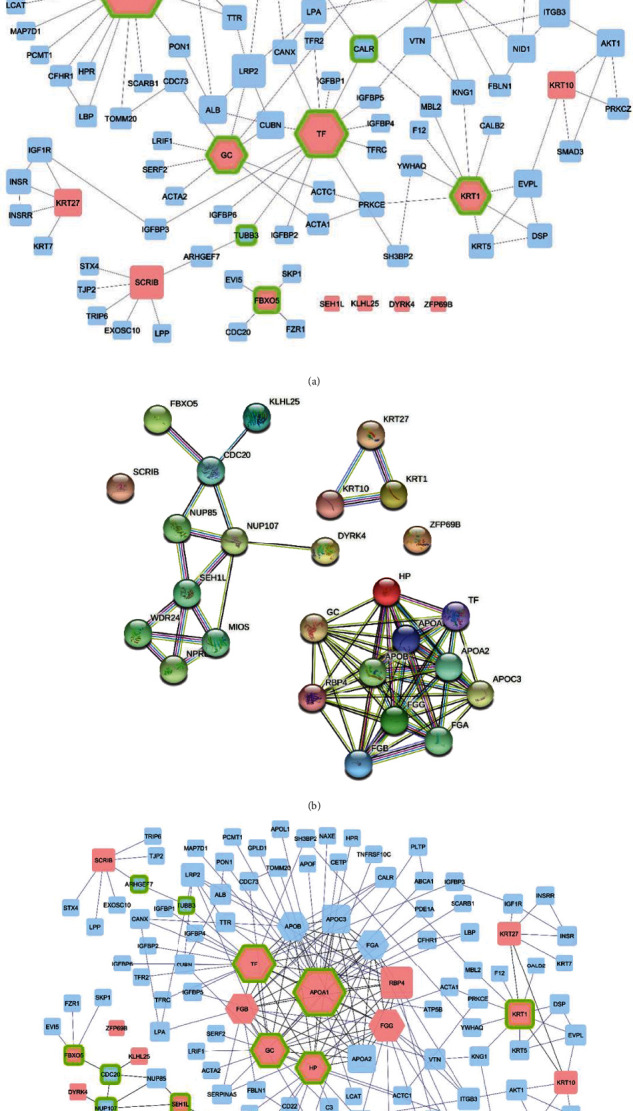
Figure 2.

(a) Protein-protein interaction network of 16 differentially expressed proteins in respondents and nonrespondents from HPRD source. The PPI network consists of 103 nodes and 137 edges. Pink nodes: 16 differentially expressed proteins identified by proteomic approaches. Blue nodes: nodes added by the HPRD in Cytoscape software. Hexagon nodes: hub proteins with the highest degree. Green border nodes: bottleneck nodes with the highest betweenness centrality. (b) Protein-protein interaction network of 16 query proteins which are related to drug treatment response of chronic ITP patient from STRING database source. The PPI network consists of 26 nodes and 73 edges. (c) Merged PPI network from HPRD and STRING database source. The PPI network consists of 110 nodes and 137 edges. The size of the nodes is adjusted based on the degree. Pink nodes: 16 differentially expressed proteins identified by proteomic approaches. Blue nodes: nodes added by the HPRD in Cytoscape software. Hexagon nodes: hub proteins. Green border nodes: betweenness centrality.
