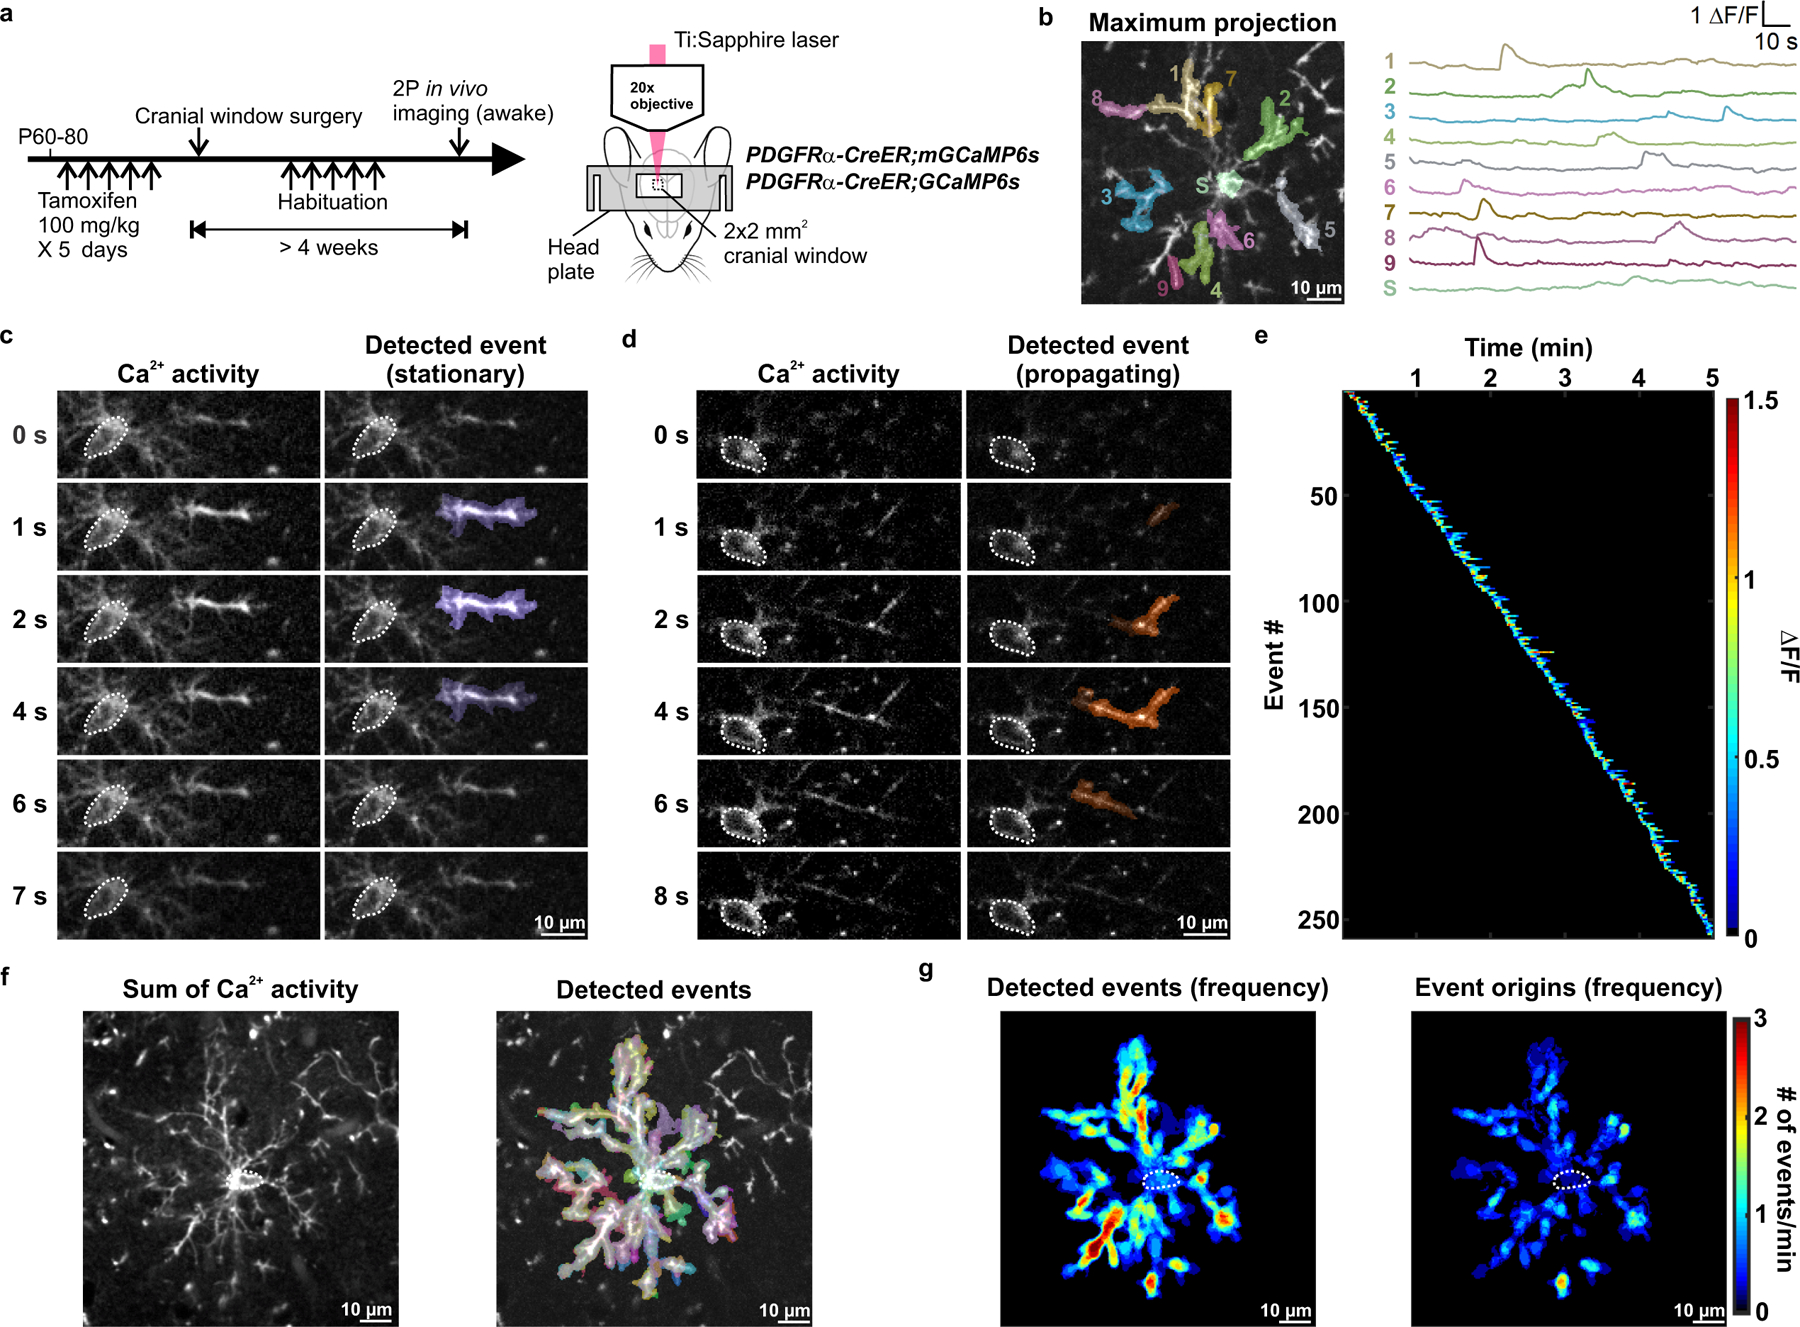
Figure 1. In vivo 2P imaging reveals that OPCs exhibit dynamic Ca2+ activity.

a, Schematic illustrations of the research design. Expression of membrane anchored or cytosolic GCaMP6s or in PDGFRα+ OPCs was induced between P60–80. OPC Ca2+ activity in the visual cortex of head-fixed, awake mice was observed through a chronic cranial window using 2P excitation from a Ti:Sapphire laser. See Methods for details. b, Example ΔF/F traces of OPC membrane Ca2+ events detected and randomly pseudocolored by AQuA software61. Example Ca2+ events were overlaid on an mGCaMP6s-expressing OPC visualized by projecting a total of 601 frames over 5 min onto a single image plane (Maximum projection). 1–9: process events. S: soma event. c-d, Frame-by-frame views of a stationary (c) and a propagating (d) OPC membrane Ca2+ event. Dotted white circles delineate the OPC cell body. e, Heatmap showing all Ca2+ events detected in an OPC over a 5-minute recording, sorted according to the time of event onset. Note absence of an increase of Ca2+ activity, which would suggest artificial photoactivation. f, Summation of all membrane Ca2+ activities and events (randomly pseudocolored by AQuA) exhibited by an OPC during a 5-minute recording. Note how the events are widespread throughout OPC soma and processes. g, Heatmaps showing overall event frequency and event origins (defined as the location where an event reaches 20% of the amplitude) of the OPC in f. Data from b-g is representative from 6 independent experiments that yielded similar results.
