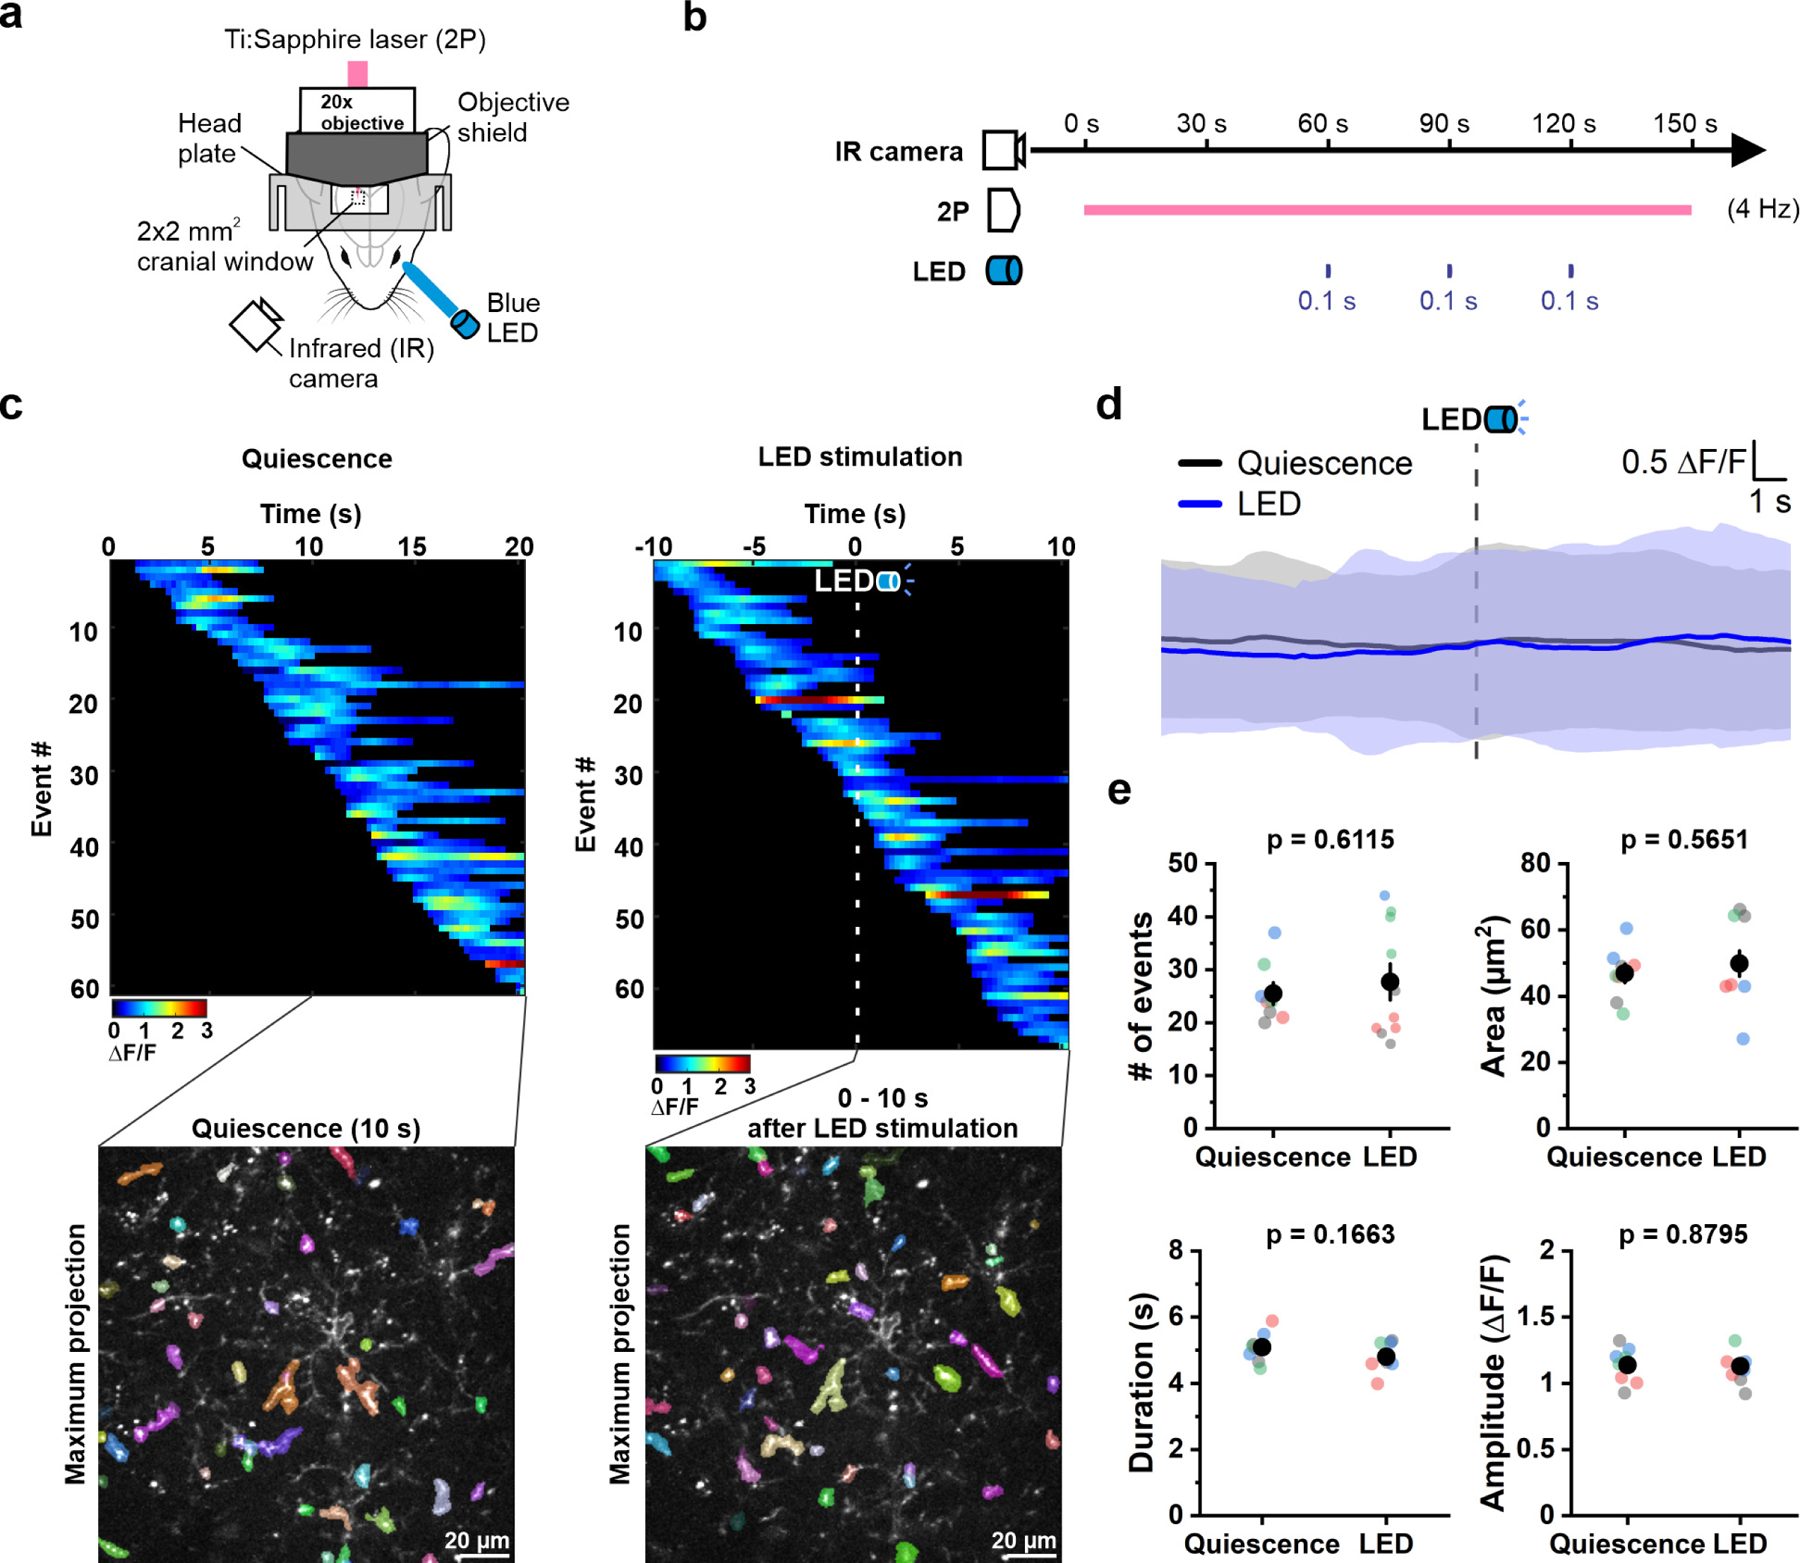
Extended Data Figure 4. Activation of visual cortex by visual stimulation with light does not alter OPC Ca2+ events in vivo.

a, Schematic illustration of the experiment setup. A customized 3D-printed objective shield was used to prevent LED light from entering the objective. The bottom part of the objective shield is not depicted in the illustration to display the cranial window. See Methods for details. b, Schematic illustration of the experiment design. Baseline OPC Ca2+ activity was recorded for 60 seconds (s) followed by 3, 0.1 s LED stimulations at 30 s intervals. An infrared (IR) camera used to observe mouse behavior during image acquisition. c, Representative heatmaps showing the ΔF/F value and duration of OPC Ca2+ events sorted according to the time of event onset. OPC Ca2+ events that occurred during 10 s of quiescence or 10 s after LED stimulation were overlaid onto a single frame (Maximum projection), respectively. d, Averaging the OPC Ca2+ activity during 20 s of quiescence (gray) and around LED stimulation (blue) suggests that LED stimulation does not influence OPC Ca2+ activity in vivo. Shaded areas represent standard deviation. n = 4 mice. e, Quantification of OPC Ca2+ event frequency, area, duration and amplitude during 10 s of quiescence and 10 s post LED stimulation. n = 8 randomly-selected quiescent periods and 10 LED trials in 4 mice (color-coded).
