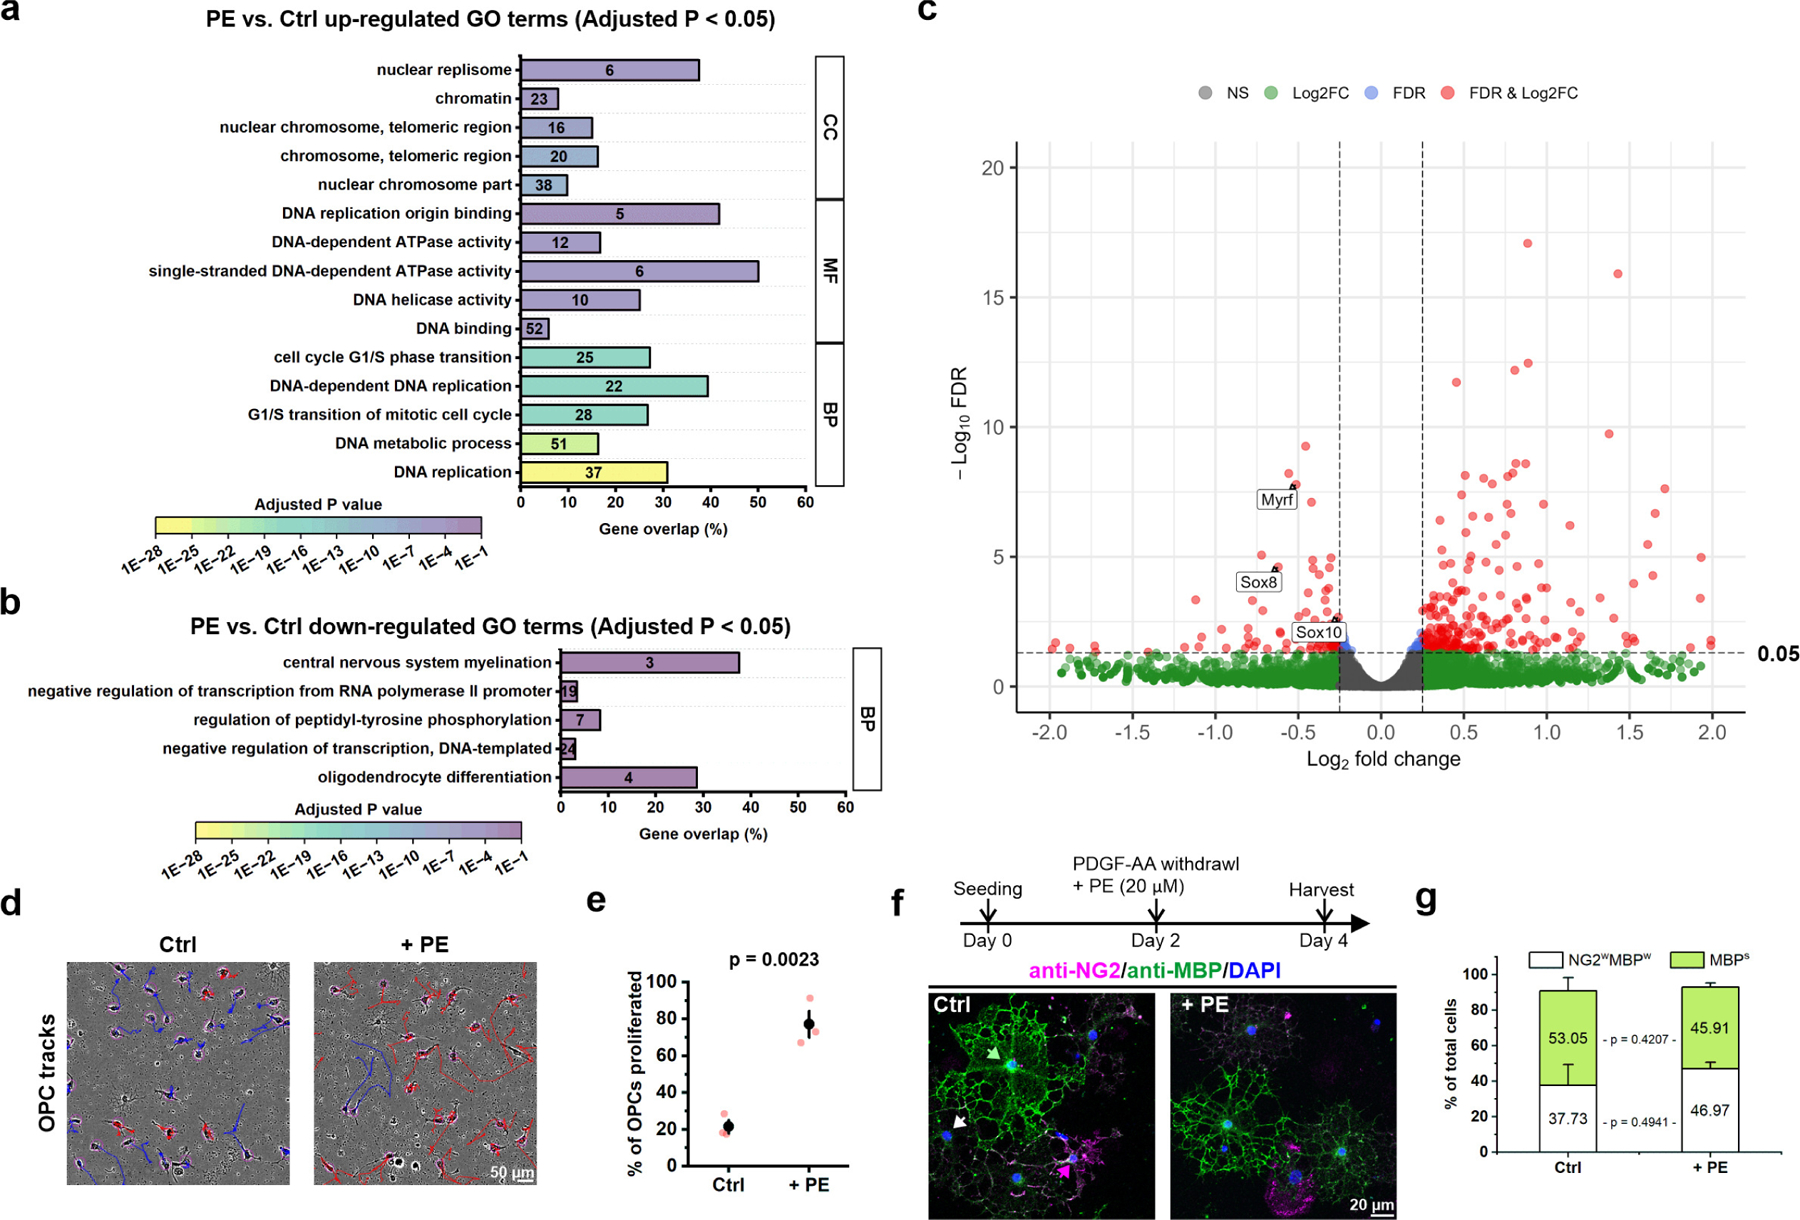
Extended Data Figure 10. PE promotes OPC proliferation in vitro.

a, Gene ontology (GO) terms that were significantly up-regulated (the adjusted p value < 0.05) in primary OPCs after 1 hour of PE treatment (20 μM, n = 3 independent biological repeats). Numbers in the bars indicate the number of genes that were significantly up-regulated after PE treatment within each GO term. If more than 5 GO terms were significantly enriched within the subontology (BP: Biological process; MF: Molecular function. CC: Cellular component), only the top 5 GO terms were shown. b, GO terms that were significantly down-regulated (the adjusted p value < 0.05) in primary OPCs after 1 hour of PE treatment. c, Volcano plot showing differential gene expression in OPCs treated with PE for 1 hour compared to control (no treatment). FDR: false discovery rate. FC: fold change. Total variables: 19,820. d, Representative live cell tracking of primary cultured OPCs for 24 hours after PE treatment (+ PE) and without treatment (Ctrl). OPCs that did not proliferate within 24 hours were labeled in blue. OPCs that proliferated at least once within 24 hours were labeled in red. e, Quantification of OPC proliferation in control and +PE conditions. n = 3 independent biological repeats. Student’s t-test. f, The experimental design of OPC differentiation assay, and representative confocal images of the OPC/oligodendrocytes mixed cultures 2 days after PDGF-AA withdrawal (Day 4) in the absence (Ctrl) or with the presence of PE (+ PE). Green arrow indicates an example of fully differentiated oligodendrocytes with strong MBP expression (MBPs). White arrow indicates an example of differentiating OPCs that have weak expression of both NG2 and MBP (NG2wMBPw). Magenta arrow indicates an example of OPCs that remain undifferentiated with strong NG2 expression. g, Quantification of f. n = 3 independent biological repeats.
