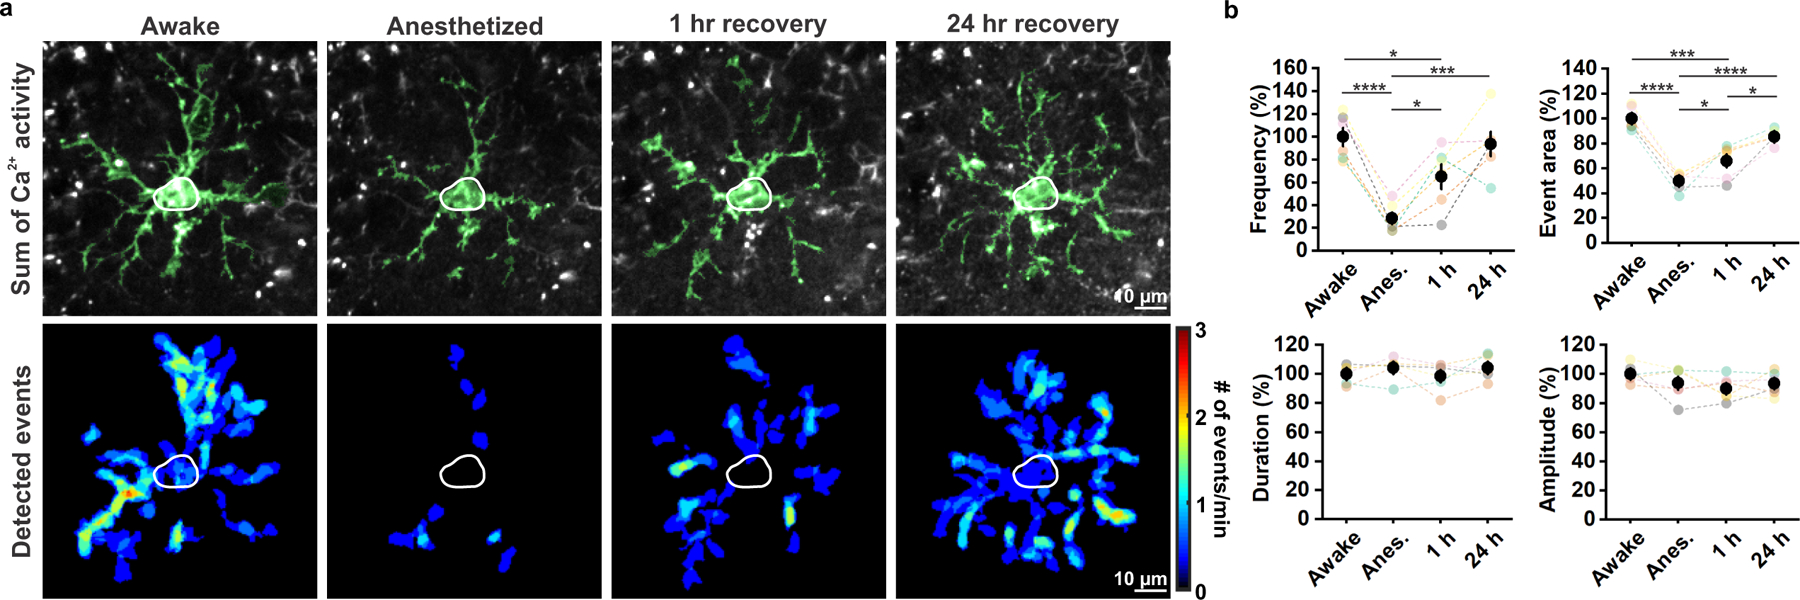
Figure 2. OPC Ca2+ activity is significantly suppressed during anesthesia.

a, Representative images of an mGCaMP6s-expressing OPC exhibiting decreased Ca2+ activity during general anesthesia. OPC morphology was visualized by summing a total of 361 frames (3 minutes) (Sum of Ca2+ activity) and highlighted in green. Heatmaps show Ca2+ event frequency (Detected events). b, Quantification of Ca2+ activity. Black filled circles and error bars represent mean ± SEM. n = 6 OPCs from 6 mice (mice are color-coded throughout). One-Way Repeated Measure ANOVA. Frequency: F = 91.3457, p = 0.0019; Event area: F = 81.9459, p = 0.0022; Duration: F = 1.2328, p = 0.4337; Amplitude: F = 0.7940, p = 0.5729. Post-hoc: Tukey. *: p < 0.05; **: p < 0.01; ***: p < 0.001; ****: p < 0.0001 throughout.
