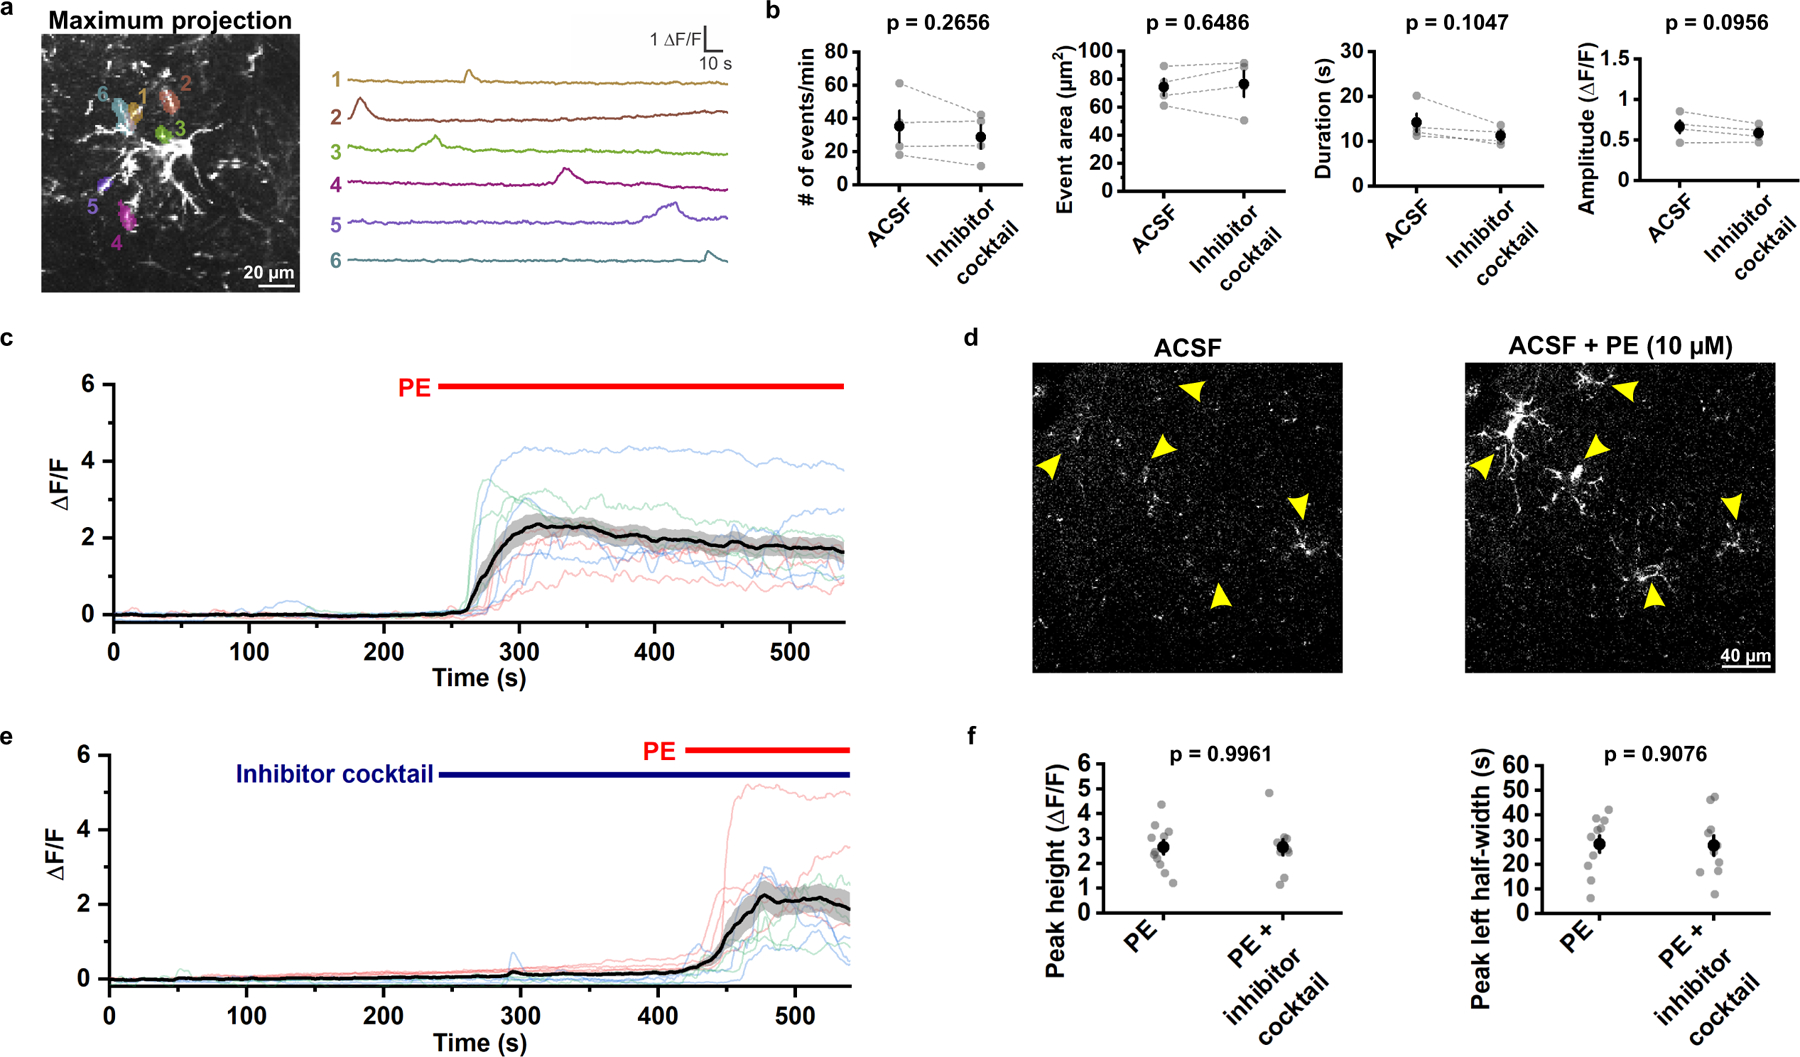
Figure 5. OPC Ca2+ transients evoked by the α1 adrenergic receptor agonist are independent of synaptic activity in vitro.

a, Example ΔF/F traces of OPC membrane Ca2+ transients observed in layer I of acute cortical slices (close to somatosensory cortex) in ACSF at RT. The morphology of mGCaMP6s-expressing OPC was visualized by perfusing 10 μM phenylephrine (PE) at the end of the recording (also see in c). b, Comparison of average event frequency, area, amplitude and duration of OPC membrane Ca2+ transients across all cortical layers with and without the inhibitor solution containing: TTX (1 μM), NBQX (10 μM), CPP (10 μM) and SR 95531 (20 μM). Black filled circles and error bars represent mean ± SEM. n = 4 recordings from 4 mice. Paired sample Student’s t-test, two-sided. c, Quantification of PE-evoked Ca2+ transients induced in OPCs (see text for details). The black line and the shaded area represent mean ± SEM. n = 11 OPCs from 3 mice. d, Representative images showing evoked Ca2+ increases in mGCaMP6s-expressing OPCs (yellow arrowheads) after exposure to PE (ACSF + PE) compared to ACSF alone (ACSF). e, ΔF/F quantification from 10 OPCs in 3 mice when exposed to PE in the presence of the inhibitor solution. The black line and the shaded area represent mean ± SEM. f, Quantification of PE-evoked OPC Ca2+ increase in the presence and absence of the inhibitor solution. Black filled circles and error bars represent mean ± SEM. n = 11 OPCs from 3 mice for PE; 10 OPCs from 3 mice for PE + inhibitor solution. Student’s t-test, two-sided.
