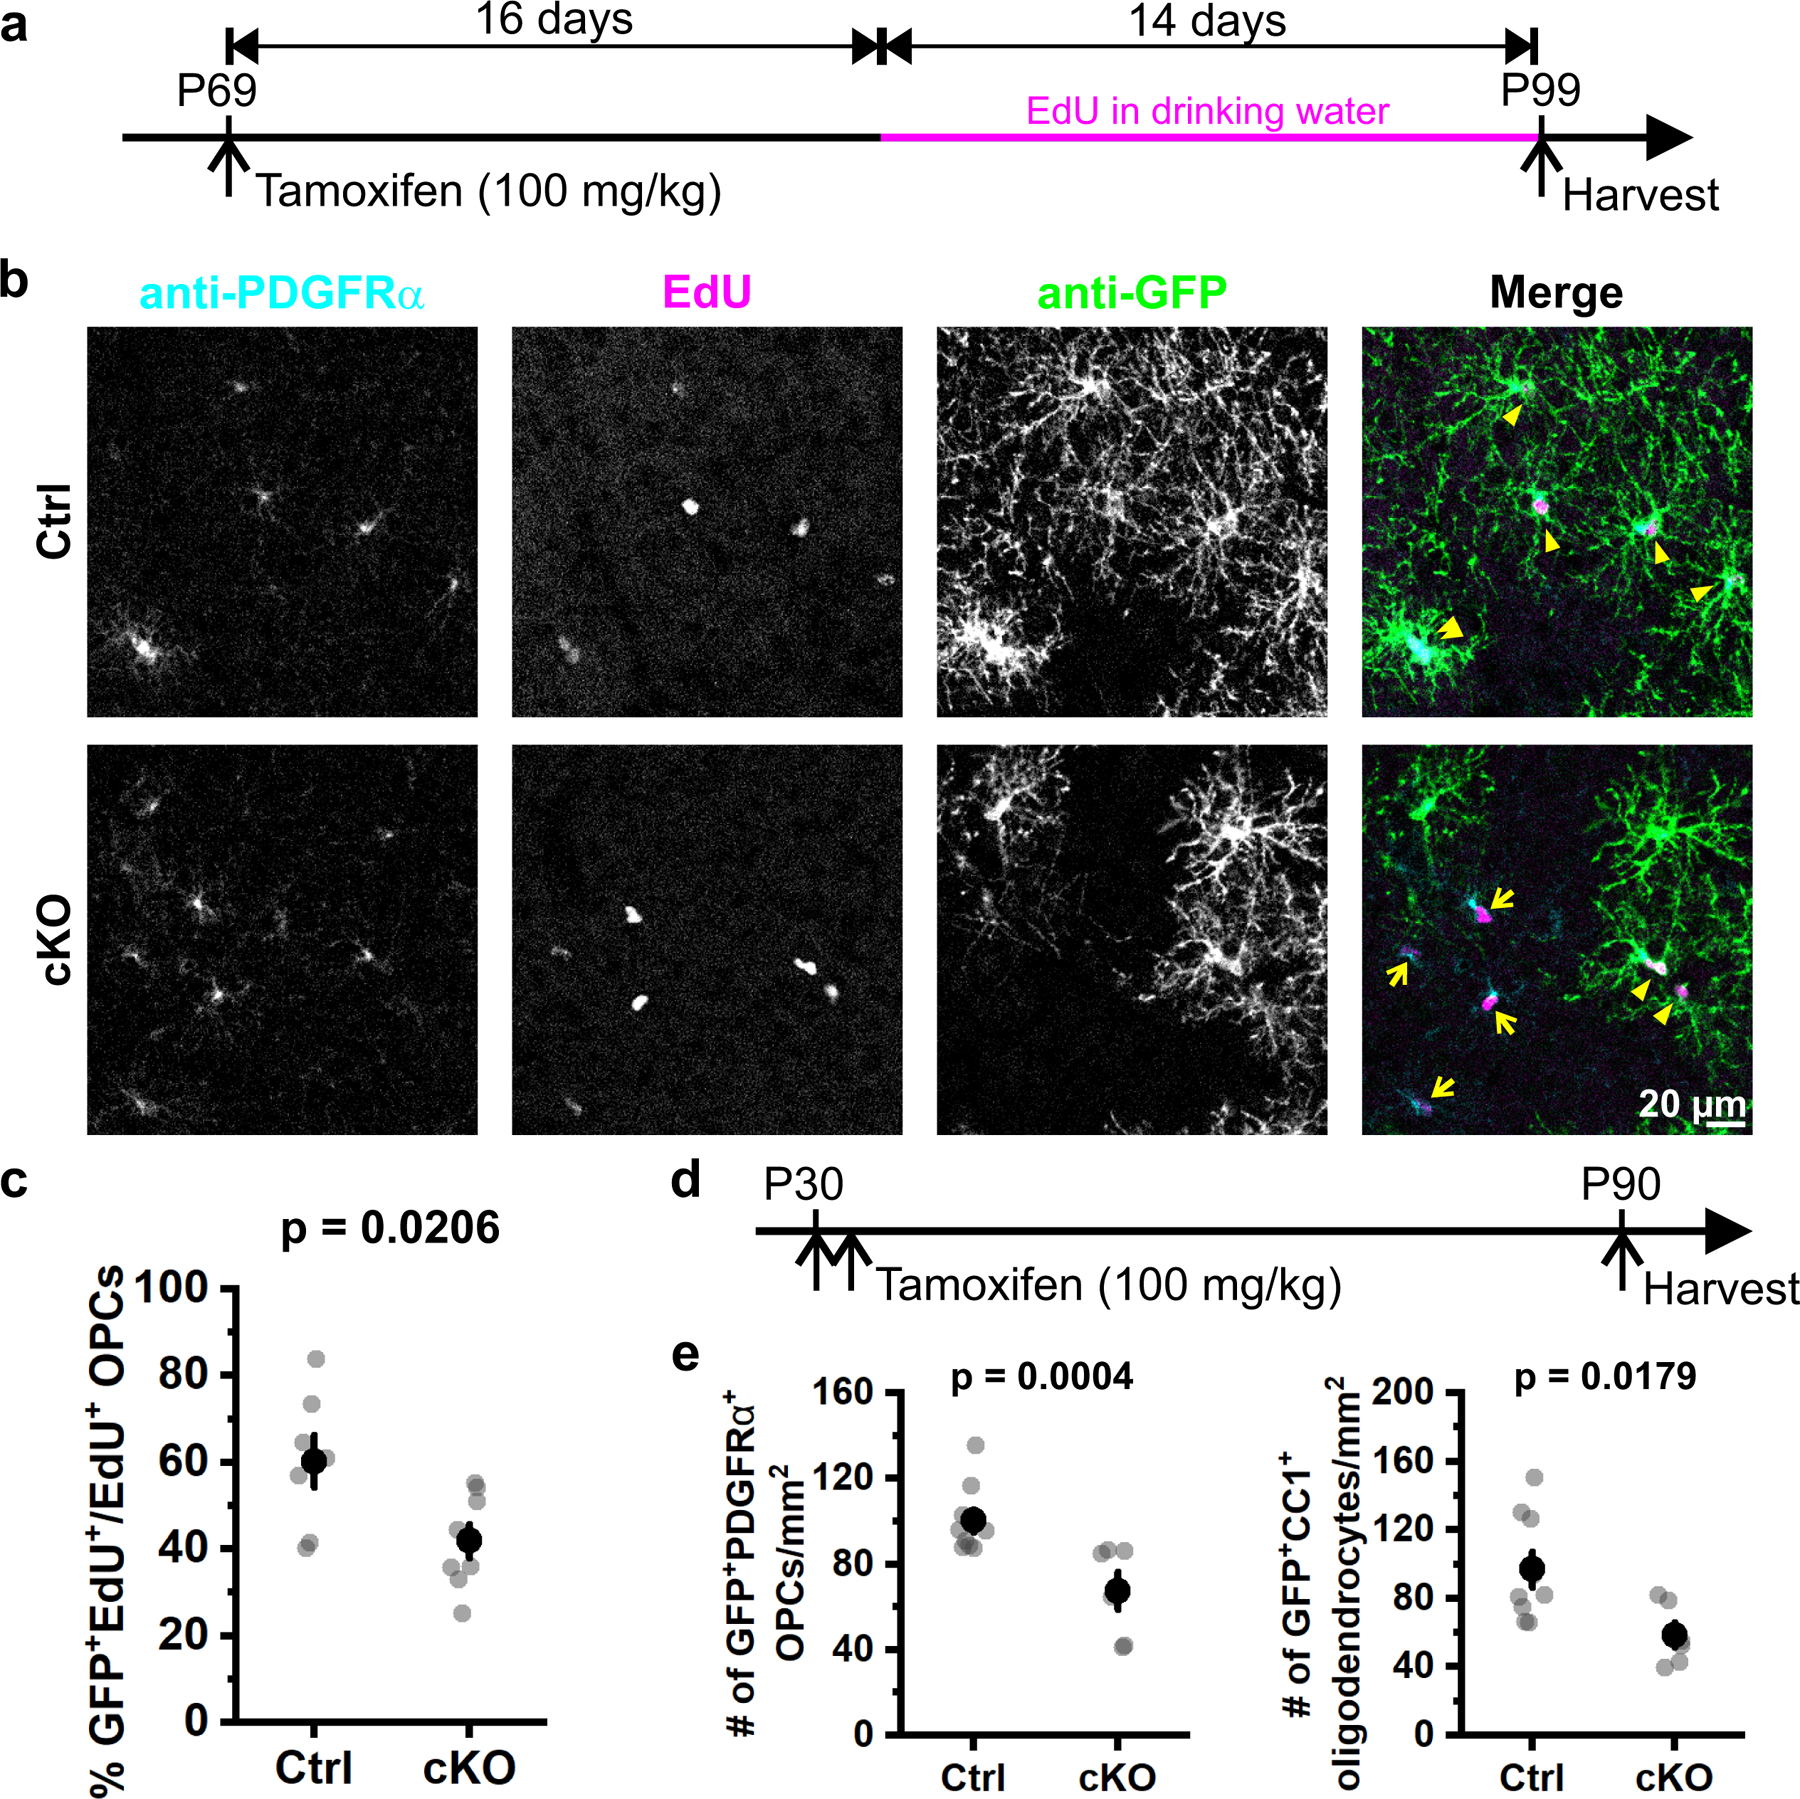
Figure 8. Selective deletion of Adra1a from OPCs reduces their proliferation.

a, Schematic illustration of the research design. Both control (Ctrl, PDGFRα-CreER;Rosa26-lsl-mGCaMP6s;Adra1awt/wt) and Adra1a cKO animals (cKO, PDGFRα-CreER;Rosa26-lsl-mGCaMP6s;Adra1afl/fl) were given one injection (i.p.) of tamoxifen at P69 to sparsely induce Cre-mediated recombination in OPCs. EdU (5-ethynyl-2’-deoxyuridine) was administered in drinking water 16 days later to label proliferating cells before brains were harvested at P99. b, Representative images illustrating EdU+ OPCs (PDGFRα+EdU+) in the mouse visual cortex. Yellow arrows highlight OPCs that were not recombined (still expressing ADRA1A) and proliferated during P85 – P99 (PDGFRα+EdU+GFP−). c, Quantification of OPC proliferation. Each data point (gray dot) represents an average of 3–4 cortical slices per animal. Black filled circles and error bars represent mean ± SEM. Ctrl: n = 7 mice; cKO: n = 8 mice. Student’s t-test, two-sided. d, Schematic illustration of the research design for OPC fate-mapping. e, Quantification of OPCs (GFP+PDGFRα+) and oligodendrocytes (GFP+CC1+) in control and Adra1a cKO mice. Each data point (gray dot) represents an average from 3–4 cortical slices per animal. Black filled circles and error bars represent mean ± SEM. Ctrl: n = 9 mice; cKO: n = 6 mice. Student’s t-test, two-sided.
