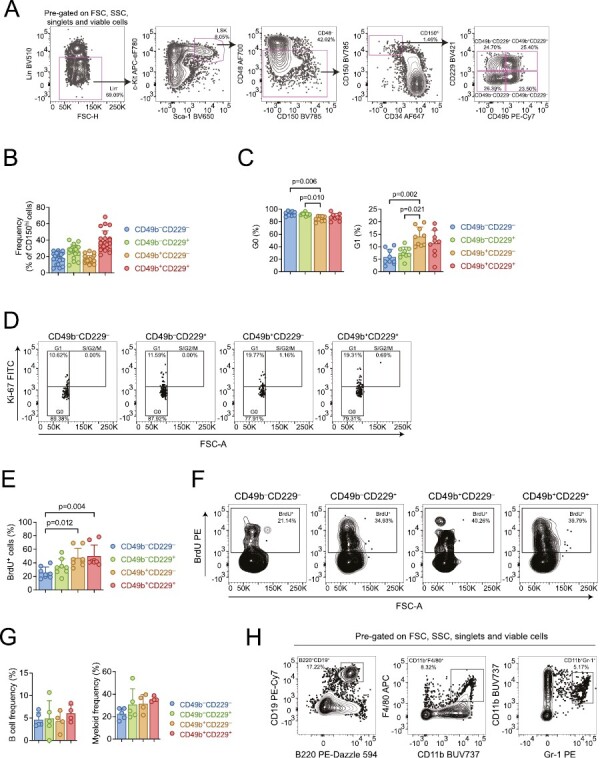
Figure 1.

CD49b and CD229 are heterogeneously expressed in the phenotypic HSC compartment. (A) Representative FACS profiles and gating strategy of the phenotypic HSC compartment (lineage−Sca-1+c-kit+ (LSK) CD48–CD34–CD150hi) and further subfractionation with CD49b and CD229. (B) Frequency of CD49b–CD229–, CD49b–CD229+, CD49b+CD229–, and CD49b+CD229+ subsets within the phenotypic HSC compartment of young adult mice. n = 22 biological replicates, 9 experiments. (C) Cell cycle analysis of CD49b–CD229–, CD49b–CD229+, CD49b+CD229–, and CD49b+CD229+ subsets by Ki-67 and DAPI staining in young adult mice. Frequency of cells in G0 (left) and G1 (right) phases are shown. n = 9 biological replicates, 2 experiments. (D) Representative FACS profile of cell cycle analysis. (E) Cell proliferation analysis by BrdU incorporation in young adult mice. Frequencies of BrdU+ CD49b–CD229–, CD49b–CD229+, CD49b+CD229–, and CD49b+CD229+ cells are shown. n = 8 biological replicates, 2 experiments. (F) Representative FACS profile of BrdU proliferation analysis. (G) In vitro analysis of the B cell and myeloid cell differentiation potential from single cell sorted CD49b–CD229–, CD49b–CD229+, CD49b+CD229–, and CD49b+CD229+ populations from young adult mice, using OP9 coculture assay. Total frequencies of clones with B cells and/or B and myeloid cells (left), and clones containing only myeloid cells (right) are shown. n = 5 biological replicates, 2 experiments. (H) Representative FACS profile of OP9 readout. B cells were defined as CD19+B220+ and myeloid cells as Gr-1+CD11b+ and/or F4/80+CD11b+. Data are represented as mean ± SD. Frequencies of parent gates are shown in FACS plots. Statistical analysis was performed using the Kruskal Wallis test with Dunn’s multiple comparison test in (C, E, G). Abbreviations: FSC: forward scatter; SSC: side scatter; FSC-H: forward scatter height; FSC-A: forward scatter area; BrdU: bromodeoxyuridine.
