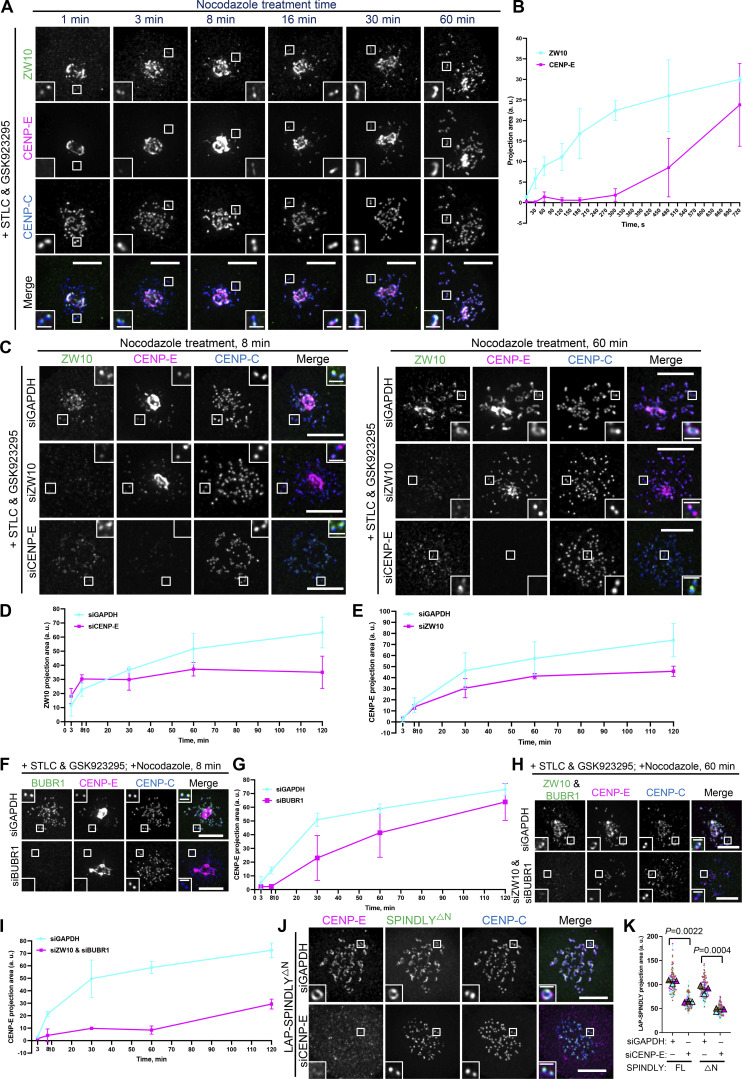
Figure 6.
CENP-E impacts fibrous corona formation after initial RZZ-S kinetochore recruitment. (A) Immunostaining of ZW10 (green), CENP-E (magenta), and CENP-C (blue) in RPE1 cells treated with nocodazole for indicated time, which had been arrested with STLC and GSK923295 overnight. Bar, 5 μm; inset bar, 1 μm. (B) Projection area of ZW10 and CENP-E in RPE1 cells treated with nocodazole for the indicated time, which had been arrested with STLC and GSK923295 overnight. More than 120 pairs of kinetochores were quantified for each condition; two pairs of kinetochores per cell. Experiments were performed in triplicate. Average value of each trial was used to calculate the result. Results are represented as mean ± SD; error bars represent SD. (C) Immunostaining of ZW10 (green), CENP-E (magenta), and CENP-C (blue) in control, ZW10-depleted, and CENP-E–depleted RPE1 cells treated with nocodazole for indicated time, which had been arrested with STLC and GSK923295 overnight. Bar, 5 μm; inset bar, 1 μm. (D) Projection area of ZW10 in control and CENP-E–depleted RPE1 cells treated with nocodazole for indicated time, which had been arrested with STLC and GSK923295 overnight. More than 120 pairs of kinetochores were quantified for each condition; two pairs of kinetochores per cell. Experiments were performed in triplicate. Average value of each trial was used to calculate the result. Results are represented as mean ± SD; error bars represent SD. (E) Projection area of CENP-E in control and ZW10-depleted RPE1 cells treated with nocodazole for indicated time, which had been arrested with STLC and GSK923295 overnight. More than 120 pairs of kinetochores were quantified for each condition; two pairs of kinetochores per cell. Experiments were performed in triplicate. Average value of each trial was used to calculate the result. Results are represented as mean ± SD; error bars represent SD. (F) Immunostaining of BUBR1 (green), CENP-E (magenta), and CENP-C (blue) in control and BUBR1-depleted RPE1 cells treated with nocodazole for indicated time, which had been arrested with STLC and GSK923295 overnight. Bar, 5 μm; inset bar, 1 μm. (G) Projection area of CENP-E in control and BUBR1-depleted RPE1 cells treated with nocodazole for indicated time, which had been arrested with STLC and GSK923295 overnight. More than 120 pairs of kinetochores were quantified for each condition; two pairs of kinetochores per cell. Experiments were performed in triplicate. Average value of each trial was used to calculate the result. Results are represented as mean ± SD; error bars represent SD. (H) Immunostaining of ZW10 (green), BUBR1 (green), CENP-E (magenta), and CENP-C (blue) in control and ZW10 and BUBR1–codepleted RPE1 cells treated with nocodazole for the indicated time, which had been arrested with STLC and GSK923295 overnight. Bar, 5 μm; inset bar, 1 μm. (I) Projection area of CENP-E in control and ZW10 and BUBR1–codepleted RPE1 cells treated with nocodazole for indicated time, which had been arrested with STLC and GSK923295 overnight. More than 120 pairs of kinetochores were quantified for each condition; two pairs of kinetochores per cell. Experiments were performed in triplicate. Average value of each trial was used to calculate the result. Results are represented as mean ± SD; error bars represent SD. (J) Immunostaining of CENP-E (magenta) and CENP-C (blue) in control and CENP-E–knockdown RPE1 cells that inducibly overexpress LAP-SPINDLY ΔN65 after nocodazole treatment overnight. Bar, 5 μm; inset bar, 1 μm. (K) Projection area of LAP-SPINDLY FL/ΔN65 in control and CENP-E–knockdown RPE1 cells that inducibly overexpress LAP-SPINDLY FL/ΔN65 after nocodazole treatment overnight. n > 120 pairs of kinetochores were quantified for each condition; two pairs of kinetochores per cell. Experiments were performed in triplicate and data from each trial was color-coded. Average value of each trial is given by a filled triangle of the corresponding color. Results are represented as mean ± SD; error bars represent SD. The P values represent a paired two-sample two-tailed t test.

