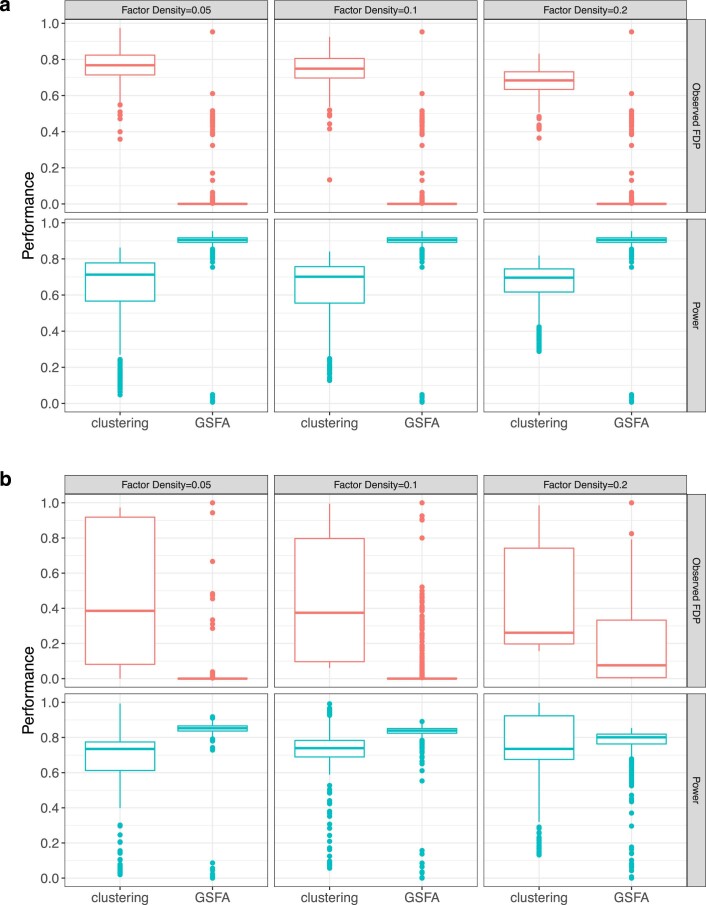
Extended Data Fig. 2. Simulation results of two-step clustering analysis vs. GSFA.
Panel a) shows Normal based simulation. The first row of Panel a) shows the false positive rates of the discovered DEGs across different factor density settings. The second row shows the power of detecting associations of a guide with a cluster or factor. The clustering method here is based on K-means. For each box, n = 300 estimates generated from 300 rounds of simulation under the given setting; the center line of the box represents the median; the lower and upper hinges of the box correspond to the first and third quartiles; the upper/lower whisker extends from the hinge to the largest/smallest value no further than 1.5 * inter-quartile range from the hinge. Panel b) Same as in a) but under the count-based setting. Clustering analysis was done using Seurat.

