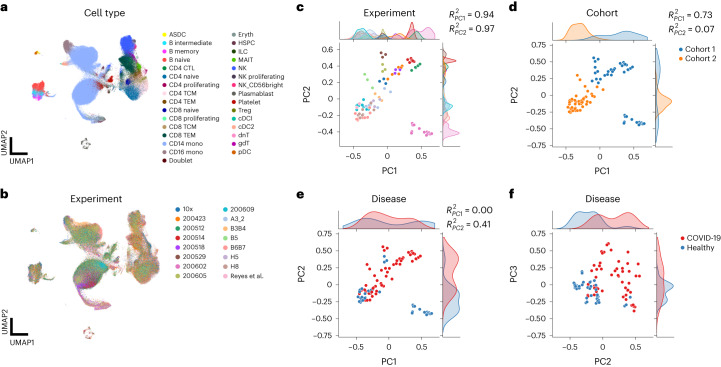
Fig. 5. scPoli sample embeddings capture technical variation and can guide data integration workflows.
a,b, Uniform manifold approximation and projections (UMAPs) of Schulte-Schrepping et al. dataset consisting of healthy and COVID-19 PBMC samples after sample-level integration. Cells are colored by cell type (a) and experiment (b), respectively. DC, dendritic cell. NK, natural killer cell. HSPC, hematopoietic stem and progenitor cell. CTL, cytotoxic T cell. TCM, central memory T cell. TEM, effector memory T cell. ILC, innate lymphoid cell. MAIT, mucosal-associated invariant T cell. c–f, Sample embeddings obtained with scPoli colored by experiment (legend shared with b) (c), cohort (d) and disease (e on principal components 1 and 2 and f on principal components 2 and 3). For each covariate the association with the first and second PCs is displayed.

