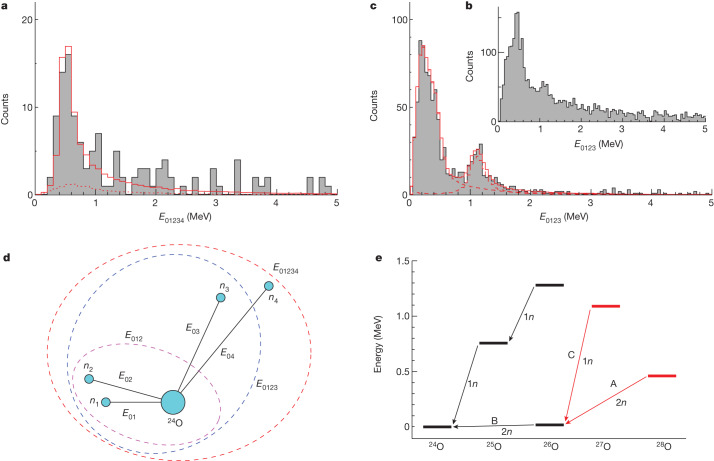
Fig. 2. Decay-energy spectra and decay scheme.
a, Five-body decay-energy (E01234) spectrum for 24O+4n events. The solid red histogram shows the best-fit result taking into account the experimental response function. The dotted red histogram shows the contribution arising from residual crosstalk that survives the rejection procedures (see Methods). b, Four-body decay-energy (E0123) spectrum for 24O+3n events. c, Same as b but gated by the partial decay energy E012 < 0.08 MeV. The dashed red histograms represent the contributions from 28O and 27O events and the solid red histogram shows the sum. d, Definition of the partial decay energies. e, Decay scheme of the unbound oxygen isotopes. The newly observed resonances and their decays are shown in red.

