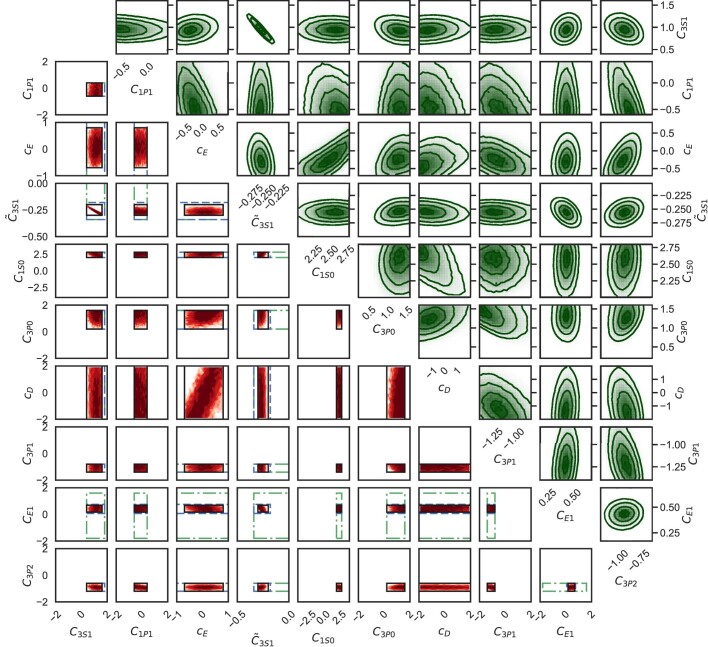
Extended Data Fig. 6. History-matching waves and Bayesian posterior sampling.
Lower-left triangle, the panel limits correspond to the input volume of wave 1. The domain is iteratively reduced and the input volumes of waves 2, 3 and 4 are indicated by the green/dash-dotted, blue/dashed and black/solid rectangles, respectively. The optical depths of non-implausible samples in the final wave are shown in red, with darker regions corresponding to a denser distribution of non-implausible samples. Upper-right triangle, parameter posterior pdf from MCMC sampling with the non-implausible samples of the history-matching analysis as starting points. We use an uncorrelated, multivariate normal likelihood function and a uniform prior bounded by the first wave initial volume. Note that the relevant posterior regions are small in some directions but larger in others, such as cD and cE.

