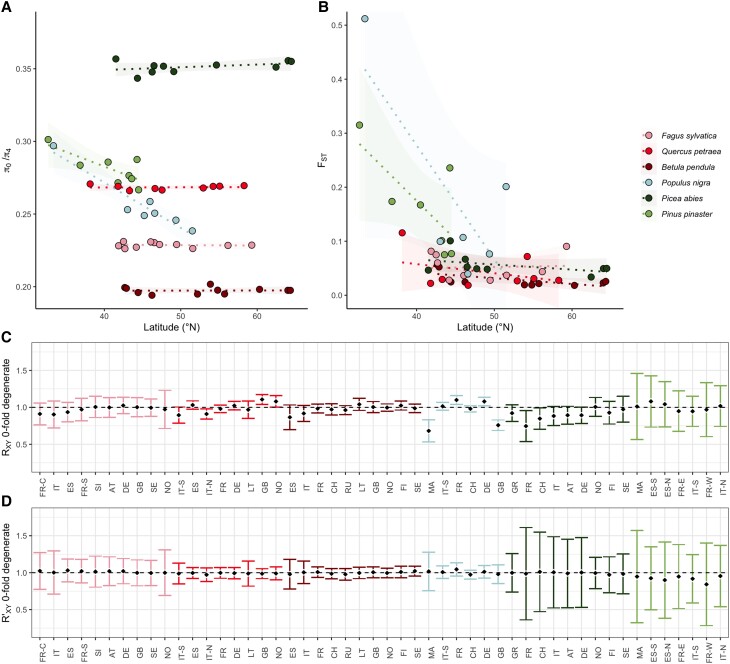
Fig. 1.
Levels of non-neutral diversity and mutation load are similar across populations within a species, despite different levels of population differentiation. The average π0/π4 per population for all species (A), and “focal” population pairwise FST (Wright's FST) for all species (B), using a “central” (see Methods) population per species as a reference, plotted against average sampling latitude for the focal population. Lines shown are linear regression slopes, along with their 95% confidence intervals. In (C), we plot Rxy for 0-fold degenerate, nonsynonymous sites, calculated per population, comparing focal populations (x) to a “central” (see Methods) reference population (y), while in (D), we plot R′xy for 0-fold degenerate, nonsynonymous sites, a measure which is normalized using putatively neutral 4-fold degenerate synonymous sites. In (C) and (D), black diamonds indicate the calculated values, while error bars are 95% confidence intervals on the estimate, calculated through jack-knifing. X axis labels are population codes, which begin with the two-letter country code of the sampling locations for each population, ordered by increasing latitude. The third letter provides additional location information for populations: C = Corsica, S = South, N = North, E = East, W = West (for exact sampling locations, see supplementary table S3, Supplementary Material online). Color codes for species, and species order, are consistent across all figure panels, with species ordered such that more closely related species are closer together.

