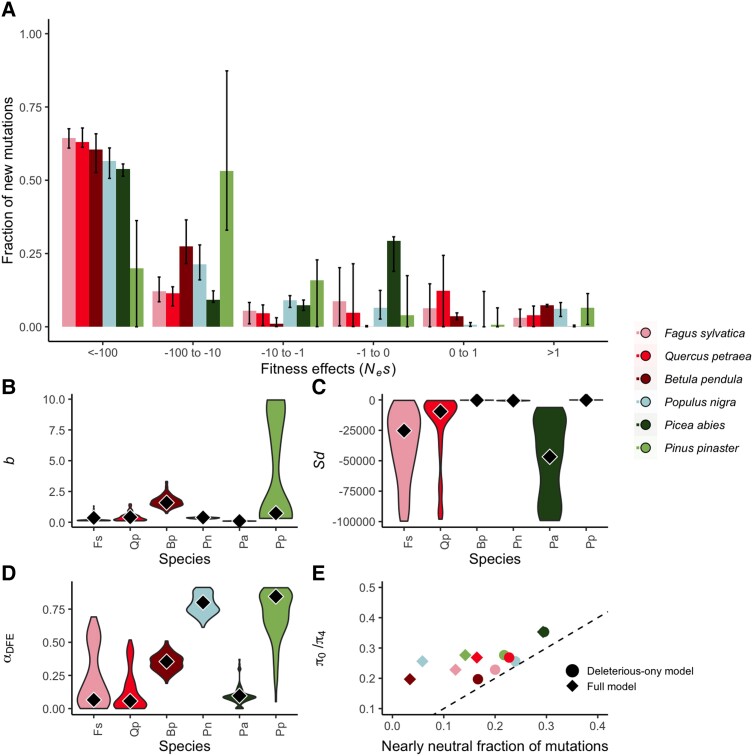
Fig. 3.
Species differences in the full DFE. (A) Shows the model-averaged discretized DFE, that is, the fraction of new mutations in each scaled fitness effect (Nes) category. Black bars indicate 95% confidence intervals on the estimated fraction, as estimated from model-averaged bootstrap replicates. (B) Violin plots show the shape parameter, b, the scale parameter, (C) Sd, for the gamma distribution of deleterious fitness effects per species, (D) αDFE, the estimated fraction of substitutions inferred to be adaptive. Black diamonds are the inferred model-averaged parameters, while violins show the 95% confidence intervals, as estimated from model-averaged bootstrap replicates. In (E), we show the fraction of slightly deleterious (−1 < Nes < 0) mutations plotted against the ratio of 0- to 4-fold degenerate nucleotide diversity. Circles represent the fraction as inferred from the deleterious-only DFE model, diamonds represent the fraction as inferred from the full (advantageous and deleterious) DFE model. The dashed line indicates x = y. For P. abies, the diamond and circle overlap.

