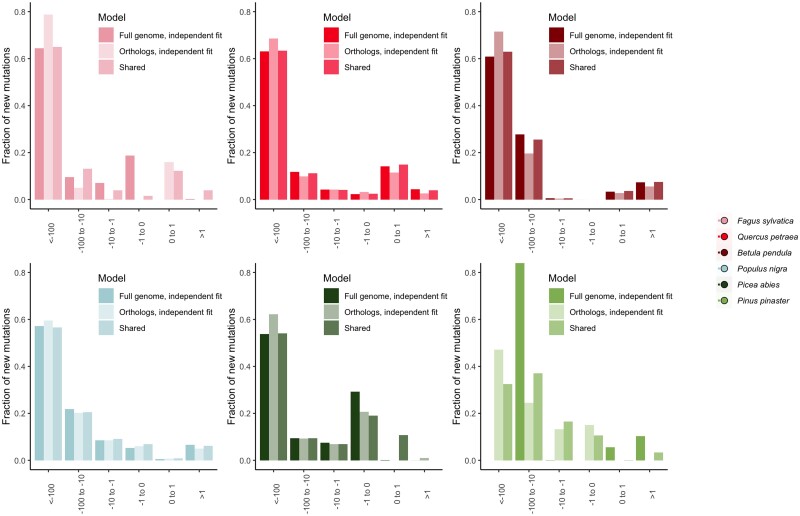
Fig. 4.
Discretized DFEs for each species, showing model comparisons for different categories of genes. Darkest bars show the independent fit for all genes, lightest bars show the independent fit for orthologs found in all species, intermediate bar shows the fit if the parameters are inferred to be shared across the all-species orthologs and the full dataset. We show model fits for the full DFE, including an estimate of the rate of ancestral allele misidentification, ɛanc, for all species.

