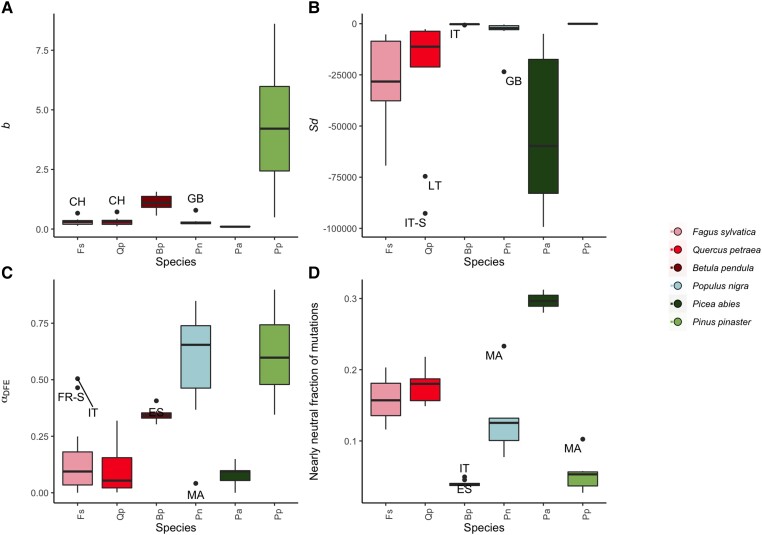
Fig. 5.
DFE parameters are consistent across populations within a species for the full DFE. Shown are the model-averaged inferred parameters. We plot the shape (A) and scale (B) parameter of the gamma deleterious distribution of fitness effects, (C) αDFE, the proportion of substitutions that are expected to be adaptive, (D) the proportion of mutations inferred to be effectively neutral, that is, the fraction of mutations for which −1 < Nes < 1. Boxplots show the distribution of values per species, with outlier points indicated as black dots, and labeled by their population codes. Population codes always start with two letter country codes, S = South. For exact sampling locations, see supplementary table S3, Supplementary Material online.

