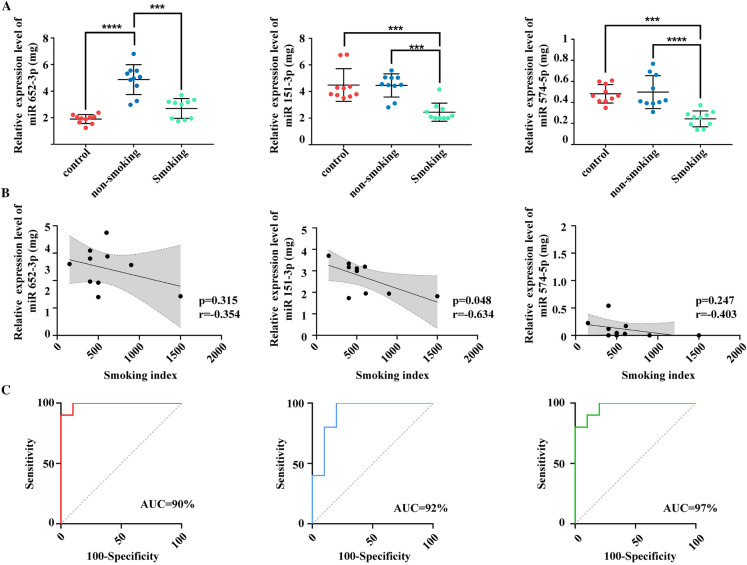
Fig. 6.
Correlation analysis and ROC analysis of miR-574-5p, miR-151a-3p, and miR-652-3p. A Relative expression levels of miR-652-3p, miR-151a-3p, and miR-151a-3p in non-smoking and smoking IA and healthy controls. B Correlation between expression levels of three plasma miRNAs and the smoking index. C ROC analysis of miR-574-5p, miR-151a-3p, and miR-652-3p. Data are presented as the mean ± SD. **p < 0.01, ***p < 0.0002, ****p < 0.0001, ns no statistical significance

