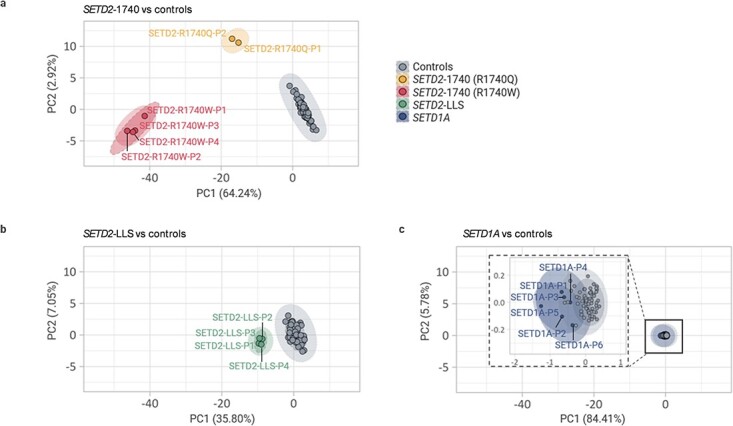
Figure 1.

Clustering of SETD2 and SETD1A based on methylation episignatures. Unsupervised PCA clustering results for SETD1A and SETD2 group. Sample name and group annotations were applied by each group after PCA. Dotted line: group names annotation, Solid line: clustering by ‘stat_ellipse’ function in R (assumes a multivariate t-distribution; applied except for the Type 2 (R1740Q) group since this function applies only when there are more than two samples in a group). (A) There were two distinct groups in SETD2 NDD patient samples. There was a significant difference between SETD2-1740 samples and controls but Type 2 (R1740Q) cases were closer to controls than Type 1 (R1740W). (B) Despite being distinct from controls, the distance of SETD2-LLS cases were much closer to the control group than SETD2-1740 Type2 (R1740Q) cases. (C) SETD1A cases were not distinguishable from the healthy controls. There are no detectable differences between the two groups of SETD1A splice acceptor variants (SETD1A-P1, P2, P3) or pathogenic variants (SETD1A-P4, P5, P6).
