Figure 3.
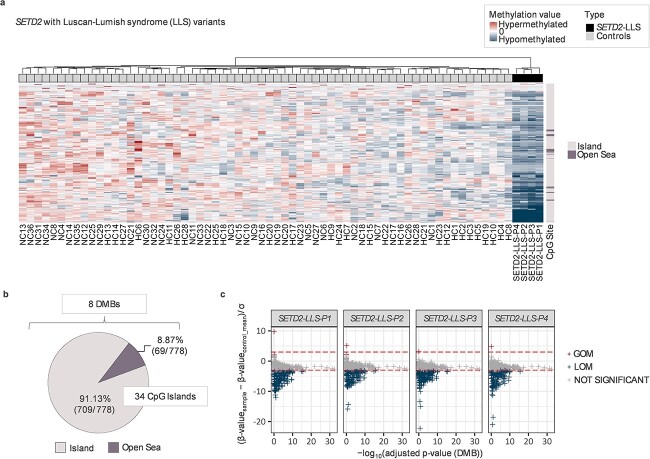
Methylation episignatures for SETD2-LLS samples. The methylation episignatures for SETD2-LLS LoF variant patients (n = 4) displayed 778 DMPs (767 hypomethylated and 11 hypermethylated), including 34 CpG Islands and 8 DMBs. (A) Hierarchical clustering on the top annotation bar revealed that 4 SETD2-LLS patients have remarkable hypomethylated profiles that are distinguishable from control samples. (B) The majority of DMPs detected as significant are CpG islands (91.13%), whereas the rest of the DMPs (69 DMPs within 8 DMBs) are located in the Open Sea area (i.e. the rest of the genomic regions except Shelf, Shore or CpG Islands). (C) Normalized methylation values were used to determine whether methylated DMPs gained or lost methylation. The horizontal line (red) indicates a confidence interval of 3 standard deviations (3SD). As a result, all four patients (all of whom are frameshift variants) had similar LOM patterns of methylation. *DMB: Differentially methylated blocks *GOM: Gain of methylation *LOM: Loss of methylation.

