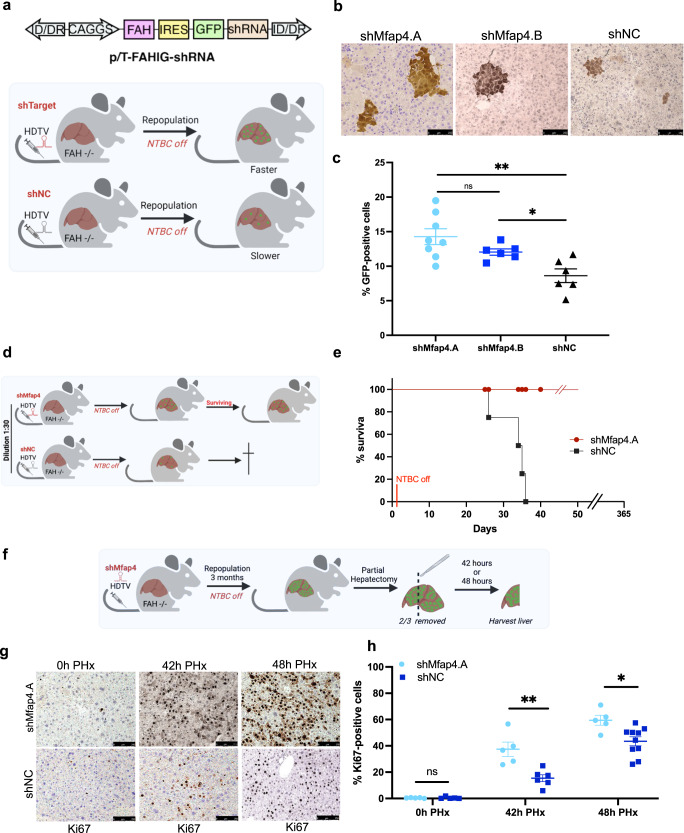
Fig. 3. Mfap4 knockdown accelerates hepatocytes proliferation and liver regeneration in vivo.
a FAH knockout mice based liver repopulation assay. The upper panel shows the outline of the transposon-based vector for the expression of the enzyme FAH, the marker GFP, and the shRNA of interest. The lower panels show the outline and rationale for the assay. If the knockdown of a certain shRNA is able to enhance regeneration and accelerate hepatocyte proliferation, we should be able to see a faster clonal expansion of GFP-positive hepatocytes compared to the control. b GFP immunohistochemistry staining (IHC) of liver tissues from FAH−/− mice injected with either p/T-FAHIG-shMfap4.A (n = 8), p/T-FAHIG-shMfap4.B (n = 6) or p/T-FAHIG-shNC (n = 6) at a 1 to 20 dilution. The liver was harvested 18 days post-injection (×200 magnification, representative pictures are shown, bar = 250 μm). c Quantification of GFP-positive hepatocytes (corresponding to (b)). Value shows % GFP-positive cells. Each dot represents one animal (*p < 0.05, **p < 0.01, ns non-significant). d Schematic outline of repopulation experiment, similar to (a). A further dilution of the amount of injected plasmids reduces the number of hepatocytes with stable expression of FAH, GFP, and the shRNA of interest, so that the FAH-expressing hepatocytes cannot fast enough expand and compensate for FAH−/− hepatocyte loss. However, an shRNA-dependent acceleration of regeneration might be able to allow survival. e Kaplan–Meier survival curve of FAH−/− mice injected with a 1:30 dilution of either p/T-FAHIG-shMfap4.A (n = 5) or p/T-FAHIG-shNC (n = 5) and SB13 (p < 0.05). f Experimental outline for investigating PH-induced liver regeneration. FAH−/− mice were injected with p/T-FAHIG-shRNA and SB13. After full liver repopulation, 2/3 PH was performed. Livers were harvested at 42 and 48 h after PH. g Representative photographs of DAB Ki67-stained liver sections 42 h (n = 5 per experimental group, n = 6 per control group) and 48 h (n = 5 per experimental group, n = 10 per control group) post hepatectomy are shown (×200 magnification). h Quantification of Ki67-positive hepatocytes (corresponding to (g)). Shown are % Ki67-positive cells at 0, 42, 48 h after partial hepatectomy. Each point represents one animal, and data shows average ± SEM (*p < 0.05, **p < 0.01, ns non-significant).

