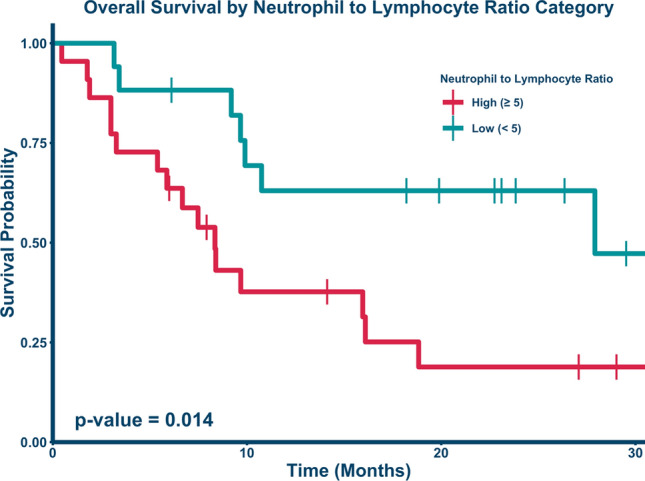
Figure 3.

Kaplan–Meier curve comparing overall survival by NTLR ratio. Patients with an NTLR above 5 (red bottom line, n = 22) had a 1-year survival of 37.7% (95% CI: 21.4%–66.3%), while patients with an NTLR below 5 (teal, top line; n = 17) had a significantly improved 1- year survival of 63% (95% CI: 43.3%–91.6%, p = 0.014). 2-year survival was reduced to 18.8% (95% CI: 7.08% to 50.2%) for the high NTLR group and remained unchanged at 63% (95% CI: 43.3%–91.6%, p = 0.014) for the low NTLR group.
