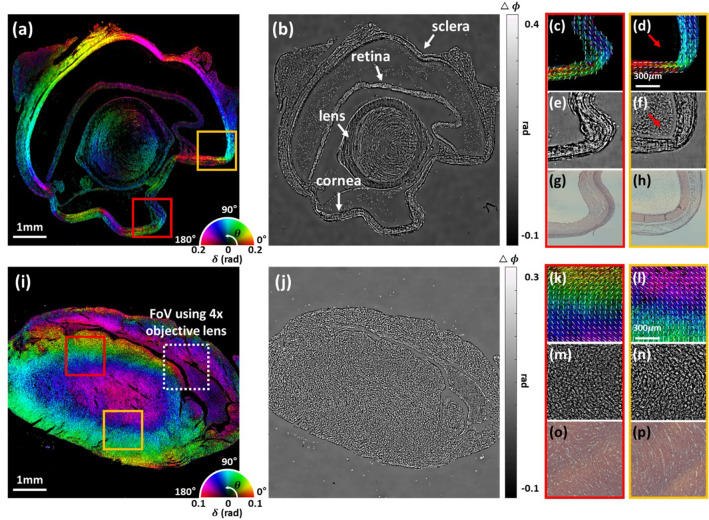
Figure 4.
PS-PtychoLM imaging results of mouse eye (a–h) and heart tissue specimens (i–p). (a, i) Quantitative birefringence maps of the mouse eye and heart tissues over the entire FoV. (b, j) Quantitative phase images of the mouse eye and heart tissues over the entire FoV. (c–f) Enlarged birefringence and phase images of the parts marked with red and orange boxes in (a), respectively. (g, h) Hematoxylin and eosin (H&E) staining images of the parts (c, d) captured with an optical microscope (Nikon, ECLIPSE Ti, 0.2NA). (k–n) Enlarged birefringence and phase images of the parts marked with red and orange boxes in (i), respectively. (o, p) H&E staining images of the parts (k, l) captured with an optical microscope (Nikon, ECLIPSE Ti, 0.2NA). Overlaid white short lines on (c, d, k, and l) indicate the mean optic-axis orientation evaluated over a small region (70 μm × 70 μm).

