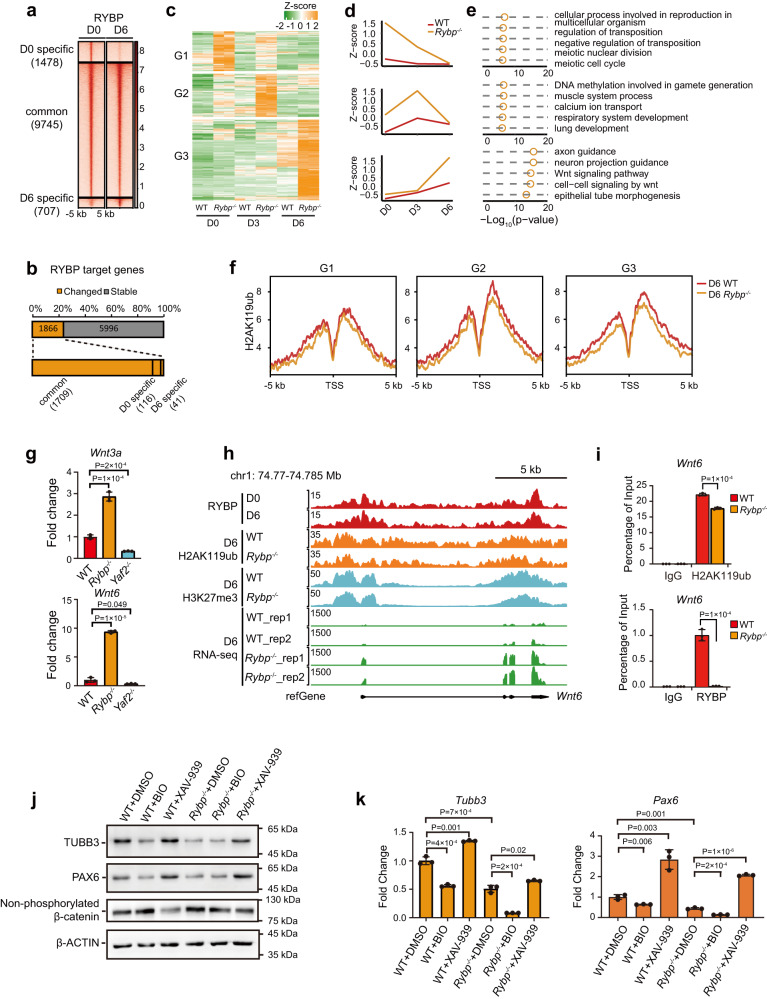
Fig. 3. Rybp loss inhibits mESC neural differentiation by activating the Wnt signaling pathway and upregulating non-neuroectoderm-associated genes.
a Heatmaps showing RYBP binding in mESCs and neural differentiated cells on day 6. The RYBP binding sites were divided into three groups based on the fold change of RYBP binding strength between day 0 and day 6. D0 specific: log2(D0/D6) >= 1, D6 specific, log2(D0/D6) <= -1. b Schematic diagram showing the proportion of differentially expressed or stable RYBP target genes during mESC neural differentiation in panel (a). c Clustering heatmap showing the expression pattern of upregulated RYBP target genes during neural differentiation of mESCs. d Line charts showing the average expression of upregulated RYBP target genes from panel (c) during neural differentiation of mESCs. e GO analysis of upregulated RYBP target genes from panel (c). Significance was calculated by hypergeometric distribution. f Average enrichment of H2AK119ub peaks in the promoters of different classes of genes from panel (c) between wild-type and Rybp−/− neural-differentiated cells on day 6. g RT-qPCR analysis of Wnt3a and Wnt6 expression in wild-type, Rybp−/− and Yaf2−/− neural-differentiated cells on day 6. n = 3 independent experiments. h Representative genomic tracks showing the normalized signal for RYBP, H2AK119ub, H3K27me3 and RNA-seq data at the Wnt6 gene locus in neural-differentiated cells on day 6. i ChIP-qPCR showing relative enrichment of H2AK119ub and RYBP peaks at the promoter region of the Wnt6 gene in both wild-type and Rybp−/− neural-differentiated cells on day 6. IgG was used as the negative control. n = 3 independent experiments. j Western blot analysis of TUBB3, PAX6, and non-phosphorylated β-catenin in day 6 neural-differentiated cells from wild-type and Rybp−/− mESCs treated with DMSO, BIO (500 ng) or XAV-939 (500 ng) from day 3 after neural differentiation. k RT-qPCR analysis of Tubb3 and Pax6 expression in the cells of panel (j). n = 3 independent experiments. For g, i, and k, data are represented as the mean values ± s.d.s with the indicated significance from two-sided t test. Source data are provided as a Source Data file.

